
22 April 2021
Lies, Damned Lies and Coronavirus
Evaluating the rollout.
By David Chilvers
 This week we look at the effect relaxing restrictions appears to have had on the incidence and impact of COVID-19. So far, there have been three phases of relaxing the lockdown rules in England:
- On 8th March, schools re-opened. Not all schools opened on the first day of that week, as many undertook Lateral Flow Device (LFD) tests on their pupils before re-opening. These tests continued to be undertaken roughly twice per week for each pupil until the advent of the Easter holidays
- On 29th March, outdoor team sports re-commenced including golf and tennis. In addition, the Rule of Six was re-introduced, which allows up to six people from different households (or all members of two different households) to meet outdoors; previously the limit had been two individuals from different households meeting outdoors
- On 12th April, non-essential retail re-opened, together with gyms, swimming pools and hair and nail salons
Concurrent with this, the vaccine programme continued at a considerable pace, with all those in the top four priority groups (aged 70 and over, healthcare workers and those deemed to be vulnerable) vaccinated once by 13th February and all those in the top nine groups (including those aged 50-69) by mid-April.
We would expect the relaxations of restrictions to increase the prevalence of those affected, whilst the vaccine rollout would be expected to protect those vaccinated against the worst effects of the disease and, this supported by increasing evidence, to offer protection against catching it in the first place.
Combining the effect of relaxations with those of the vaccine rollout, we might hypothesise the following:
- School aged children (aged 5-18): we would expect infection rates to increase from around 15th March (one week after the return to school) and reduce again from about 5th April (one week into the Easter holidays). There is no vaccine mitigation effect for this age group
- Those aged 50+: we would expect infection rates, hospitalisation and mortality to decline from around three weeks after the first vaccination date and then possibly increase a little from 5th April onwards due to the impact of the relaxations and the plateauing of the impact of the first jabs
- Those aged 19-49: we would expect infection rates to increase from 5th April onwards as the increased social mixing from the relaxations would not yet have much mitigation effect from the vaccination programme only just starting among those aged 45-49 and not at all for those aged 19-44
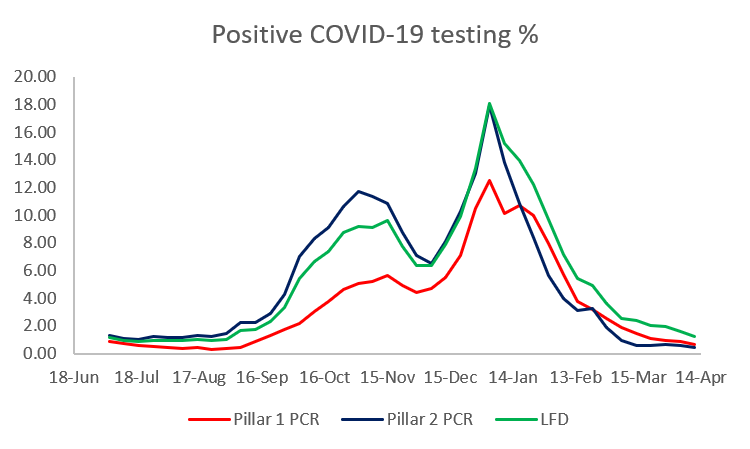
The impact of all these events of the number on positive COVID-19 tests (cases) is not straightforward to assess due to the large variations in the number and type of tests undertaken. Pillar 1 PCR tests are typically undertaken in hospitals and care homes; Pillar 2 PCR tests are typically undertaken at large regional or mobile sites; LFD tests are taken in workplaces, educational establishments and at home and differ in that results are available within 30 minutes rather than needing to be analysed at one of the Lighthouse laboratories. Pillar 2 tests are normally taken when symptoms are present, Pillar 1 tests and LFD tests are more likely to be taken by people without symptoms.
LFD tests jumped from around 350k per day to around 1 million per day when schools re-opened and the percentage of positive tests in schools was much lower than average as we showed a few weeks ago. The percentage of tests which are positive is different for the different types of test, as shown below, so any change in the number and type of tests can affect this.
The percentage of Pillar 2 tests that are positive is, as expected, higher than for the other two tests, although this difference has disappeared in recent weeks, as the incidence of COVID-19 has fallen to very low levels of under 2% in recent weeks. This convergence means that comparing the incidence of COVID-19 by aggregating data from all tests is not as problematic as it has been previously.
To look at trends among the various age groups, we use the approach we have previously taken of seeing what percentage of positive tests have occurred among each age group. Looking at the first priority groups, those aged 70+:
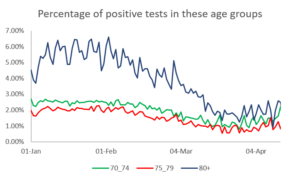
This shows exactly the trend hypothesised – declining steadily as the vaccine rollout progressed, stabilising and starting to go up a little as the vaccination effect levels off and the impact of more social mixing kicks in.
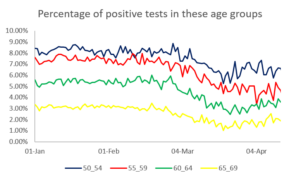
For those aged 50-69, vaccination did not start until early/mid-February, so the decline in the lines starts, as expected, in early March. As with the older groups, this tails off in recent weeks and is starting to increase. It is important to remember here that the number of positive tests has continued to decline and so this effect of the percentage of cases in these age groups rising is not likely to be reflected in the absolute numbers of cases
If we now look at school aged children, we can see the following trend:
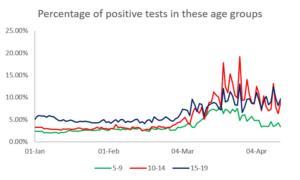
The return to school on 8th March did indeed see a marked rise in the percentage of positive tests coming from school aged children, which has tailed off a little in recent weeks in line with the expected effect of the Easter school holidays.
Finally, if we look at 20-49 year olds, as yet largely unvaccinated but likely to be mixing socially perhaps more than any other age group, the chart below shows the trend.
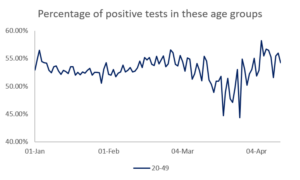
These was a steady period up until early March, followed by a fall for a couple of weeks. This is probably just an arithmetic result of the percentage of positive cases going up so much among school aged children. However, since late March, the percentage of positive tests among 20-49 year olds has gone up steadily, probably reflecting increased social mixing and a low level of vaccination among this group.
In aggregate, the trends are exactly in line with the effects suggested by the three hypotheses and confirm that the vaccination programme seems to have an impact on actually catching COVID-19, whilst the relaxation of restrictions are impacting on the groups one would expect (schools opening pushes up the proportion of positive tests among children, the 29th March relaxations push up the proportion of positive tests among the age groups not yet vaccinated).
It is worth emphasising that these impacts are all within an environment where overall cases rates are not increasing, rather there is a shift in the groups of people being infected entirely in line with what would be expected. As long as the vaccination programme continues to offset the impact of increased social mixing, the prospects for sticking to the next stage of the rollout on 17 May look promising.
This article is one of a series, find last weeks on local area data here.
