

15 April 2021
Lies, Damned Lies and Coronavirus
Local area data.
By David Chilvers
 This week we look at how the prevalence of COVID-19 has changed over the last year by drilling down into the smallest area for which data is released. This type of area is an MSOA (Mid-level Special Output Area) and there are 6,727 of these areas in England and Wales. We looked at these areas last autumn, to highlight that the second wave of COVID-19 had taken off in areas around universities following the return of students to their campuses.
ONS updates data on the number of cases in each MSOA on a weekly basis. Where there are less than three cases in an MSOA in a week, the data is suppressed and shown as a blank. This does not mean there were no cases in that MSOA in that week, merely that there were less than three – so either 0, 1 or 2 cases in that week.
During last summer, there were very few MSOA’s with three or more cases. During the wave 2 peak in January/February this year, there were very few MSOA’s with less than three cases. The chart below shows the % of MSOA’s with three or more cases each week since the start of the pandemic (remember that up until June 2020, testing was at very low levels and so the number of cases was vastly understated).
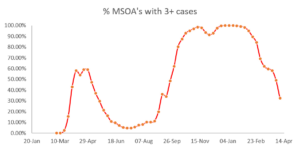
This chart confirms that in the January/February peak, virtually no MSOA’s had less than three cases in any week. It also shows that the same phenomenon was present from the end of September 2020 until the end of 2020 – so hardly any local areas had less than three cases right the way through from early October 2020 until mid-February this year.
And where an MSOA had more than three cases, the average number of cases per MSOA followed a similar pattern to the above chart, but peaking more in January/February.
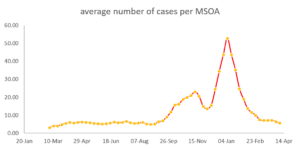
These two charts show that since mid-February, not only has the number of MSOA’s with three or more cases steadily decreased but the average number of cases per MSOA has also steadily decreased. The percentage of MSOA’s with three or more cases has not yet reached the very low levels achieved last summer, but the average number of cases per MSOA has done so:
| Month | % MSOAs >=3 | Average cases per MSOA 1 |
| Jul-20 | 4.68% | 6.42 |
| Apr-21 | 32.42% | 5.50 |
Note 1 Average for areas with at least 3 cases
Geographically, there is a wider spread of three or more cases, but no greater average number of cases when this threshold is reached. So, what are the characteristics of the areas where there are still three or more cases in recent weeks?
Firstly, let’s look at for how many weeks MSOA’s have identified three or more cases.
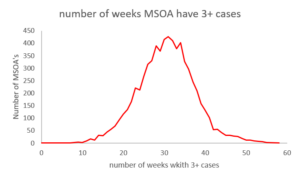
I was quite surprised by the spread on this chart. At one extreme, there were 2 MSOA’s that had three or more cases in 55 of the 58 weeks since March last year. These are Burngreave & Grimesthorpe in Sheffield and Kingsway in Rochdale. There are larger than average MSOA’s in total with 12,300 and 10,636 people respectively (a typical MSOA contains 7,800 people). During the pandemic, these two MSOA’s had 1,315 and 2,763 cases respectively. There are 49 MSOA’s that had three or more cases in 50 or more weeks, over half of these are in Bradford (15 MSOA’s) and Leicester (12 MSOA’s). Leicester has probably been under COVID restrictions for longer than any other city in the UK and this analysis underlines that.
At the other extreme, the MSOA Bridport South & West Bay had only seven weeks with three or more cases out of the 58 weeks since early March last year. These seven weeks were all in the eight weeks between 23rd December last year and 10th February this year and the total number of cases, excluding weeks when there were 0-2 cases, was 36. Even if there were two cases in the 51 weeks with 0-2, this would be a maximum of 138 cases and more likely less than 100. Is this due a small population? Not really, as there are 5,675 people in this MSOA (an average MSOA has 7,800 people). This MSOA is about half the size of Burngreave & Grimesthorpe in Sheffield and Kingsway in Rochdale but has had about 5% of the number of COVID-19 cases.
Looking again at the bottom range, there are 48 MSOA’s with 3 or more cases in 13 or less weeks out of the 58, including those in Cornwall and Isles of Scilly (17 MSOA’s) and Devon (18 MSOA’s). This analysis confirms that the South West has fared against COVID-19 better than most parts of the UK.
Does this geographical pattern hold up at the moment? The table below shows the regional distribution of the one third of MSOA’s with two or less cases in the latest week (ending 7th April 2021), compared to all MSOA’s.
| Region | MSOA’s <3 cases | All MSOAs | Index | average |
| East Midlands | 6.71% | 8.47% | 79% | 5.99 |
| East of England | 12.43% | 10.84% | 115% | 5.52 |
| London | 15.49% | 14.46% | 107% | 4.39 |
| North East | 4.64% | 5.02% | 92% | 4.85 |
| North West | 12.41% | 13.71% | 91% | 5.28 |
| South East | 19.36% | 16.17% | 120% | 4.71 |
| South West | 13.11% | 10.35% | 127% | 4.18 |
| West Midlands | 10.82% | 10.72% | 101% | 5.13 |
| Yorkshire and The Humber | 5.04% | 10.26% | 49% | 7.00 |
| England and Wales total | 100% | 100% | 100% | 5.50 |
Of all the MSOA’s in the latest week with 0-2 COVID-19 cases, 5.04% were in Yorkshire and the Humber, around half of the percentage of all MSOA’s that are in that region – thus generating an index of 49%. Regions where the number of low incidence MSOA’s is high are the South West, the South East and the East of England; regions where the number of low incidence MSO’s is low are Yorkshire and the Humber and the East Midlands. But the average number of cases is not much higher than average in these regions, so again it is the wider presence of the disease in small areas in these regions rather than large clusters of disease. An analysis of the number of cases in each MSOA in Yorkshire and the Humberside confirms this – there are only four MSOA’s in Yorkshire with more than 20 cases in the latest week out of 461 MSOA’s in the region.
The vaccine programme continues its successful rollout, in spite of Boris Johnson’s rather strange comment yesterday that lockdown, not the vaccines, were responsible for the drop in cases, hospitalisation and deaths. It is very clear that older age groups, which are most vaccinated, are seeing the greatest impact of vaccination and that this protection should balance the increased social mixing that will occur following the relaxations on 29th March and 12th April. We will see the impact of those relaxations over the next few weeks but it is clear from the above analysis that the prevalence of COVID-19 continues to decline, albeit not uniformly across the country and as yet not down to the levels seen last summer.
This article is one of a series, find last week’s article “second jabs” here.
