
25 March 2021
Lies, Damned Lies and Coronavirus
Schools back – Part 2!
by David Chilvers
 Four weeks ago, we looked at the impact the return to school on 8 March might have on COVID-19 infection levels and tried to evaluate the risk. We now have early data on how the number of positive tests among school aged children has developed in the two weeks since the return to the classroom. To analyse this, we use the same approach we used to look at the impact of the vaccine rollout; this involves looking at the percentage of positive tests that are in a particular age group and seeing if the anticipated trend has materialised.
Before looking at this for school aged children, it is worth updating progress among the vaccinated age groups, shown below.
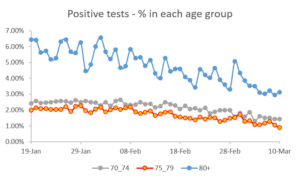
This chart shows that the percentage of positive tests in the three oldest age groups has continued to decline over time. The decline is the steepest and longest for those aged 80+, halving from 6% in early February, when vaccine protection would have started for this age group, to 3% in mid-March. Declines are also apparent for those aged 75-79 (from around 2% of positive tests in mid-February to around 1% in mid-March) and those aged 70-74 (from just over 2% to just under 1.5%). These declines are all consistent with what was predicted from the point when vaccination should have started to impact upon possible infection. Declines in infection were seen as a bonus from the vaccination programme but these results confirm that, with the resultant drop in hospitalisations and mortality that will inevitably follow.
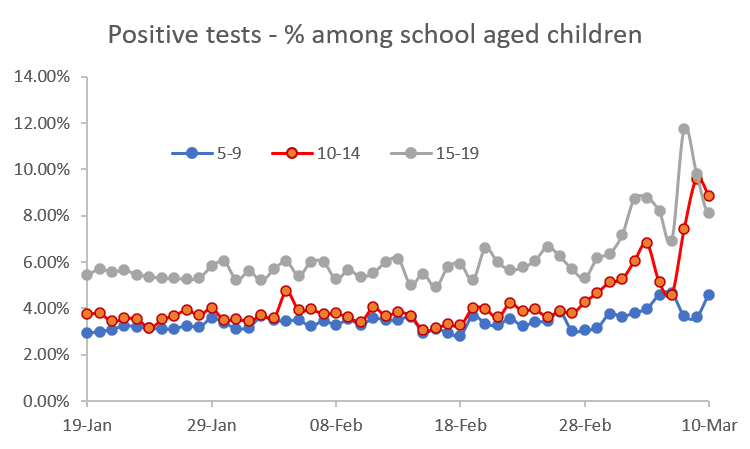
A similar chart can be produced for school aged children, those aged 5-9, 10-14 and 15-19 (we have to use these five-year age bands even those 19+ will not be at school, as that is what PHE use). As the percentage of positive cases among the older, vaccinated age groups has declined, the percentage among other age groups will have increased – this is a mathematical certainty given the percentages need to add up to 100%. So, to minimise the impact of falling rates among the older age groups, I have shown the percentage of positive tests for school aged children just using all under 60 as the base.
For children aged 5-9, this data shows a slight upward trend following the return to school. However, for those aged 10-14 and 15-19, the percentage of positive cases does start to increase sharply from the end of February. Some of this will be due to increased testing. From late February, the number of Lateral Flow Device (LFD) tests increased substantially, with the aim of offering every secondary school pupil two tests per week.
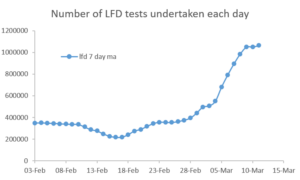
If you test more, you will pick up more positive tests (an observation Donald Trump took to extremes by suggesting tests should be banned and there would then be no cases of COVID-19). From a fairly steady average of around 350k LFD tests a day during February, the number rose to above 1 million per day by mid-March; the additional 650ks test per day will generate additional positive cases, which will then distort the trend.
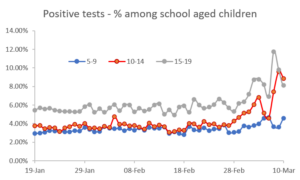
To adjust for the increased testing, I have looked at the positivity rate of LFD tests and supplemented this with some data produced by TES for the week ending 10th March. This latter data showed that more than 4.5 million LFD tests were undertaken in schools and colleges between 4 and 10 March but that only 2796 were positive; this is a positivity rate of 0.06%. Applying this to the additional 650k tests per day generates an estimated 398 positive tests per day accruing from the additional testing. We can, in essence, deduct this number from the positive LFD tests among school age children to produce a figure which estimates what the number of positive tests would have been had the additional LFD tests not been undertaken. This process attempts to remove the effect of the additional tests from the estimates and show the real underlying trend that would have occurred had testing not been increased.
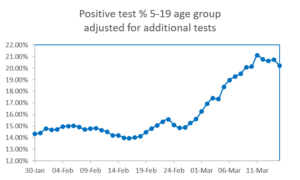
This chart does show that there is an upward trend in positive cases among school aged children, even after correcting for the impact of the large number of additional tests carried out in schools. In absolute terms, as mentioned previously, the rise in the number of positive tests since schools returned is about 400 per day – not large in the context of a continuing level of around 5,000 positive tests per day during the first half of March. This represents a rise in cases of about 8% per day, an impact but so far not a large impact.
This conclusion is reinforced from the number of outbreaks of COVID-19 in educational establishments, as shown in the PHE weekly Influenza and COVID-19 Surveillance Survey.
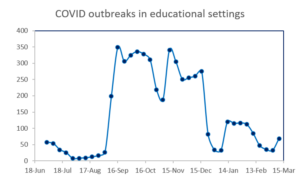
As can be seen, the number of COVID-19 outbreaks in educational settings did pick up slightly in the latest week (week ending 10th March) but is still at a lower level than earlier in this lockdown.
Putting together this data with that on the level of positive cases among school aged children, it is clear that, at present, the return to school on 8 March has generated a small increase in positive cases among school aged children, but not at a sufficient level to reverse the downward trend in total positive cases seen since the start of 2021. This is in spite of a large increase in the number of tests among school aged children which is only picking up a positivity rate of 0.06%. So far, so good.
This article is one of a series, the previous article on testing numbers is here.
