
30 September 2021
Lies, Damned Lies and Coronavirus
Schools back – Part 3!
by David Chilvers
Earlier this year, we looked at the impact of the return to school in March, following a two-month lockdown. This was our conclusion:
As can be seen, the number of COVID-19 outbreaks in educational settings did pick up slightly in the latest week (week ending 10th March) but is still at a lower level than earlier in this lockdown.
Putting together this data with that on the level of positive tests among school aged children, it is clear that, at present, the return to school on 8 March has generated a small increase in positive tests among school aged children, but not at a sufficient level to reverse the downward trend in total positive tests seen since the start of 2021. This is in spite of a large increase in the number of tests among school aged children which is only picking up a positivity rate of 0.06%. So far, so good.
So, the return in March appeared to generate a small increase in positive tests among school aged children. The constraining factor then was that most of the rest of society was still in a tight lockdown from which we only gradually emerged in May and then finally on July 19th. Given that social interaction since then has been at much higher levels than in March, has this led to large rises in positive tests among school aged children, as many experts predicted and seems to have occurred in Scotland?
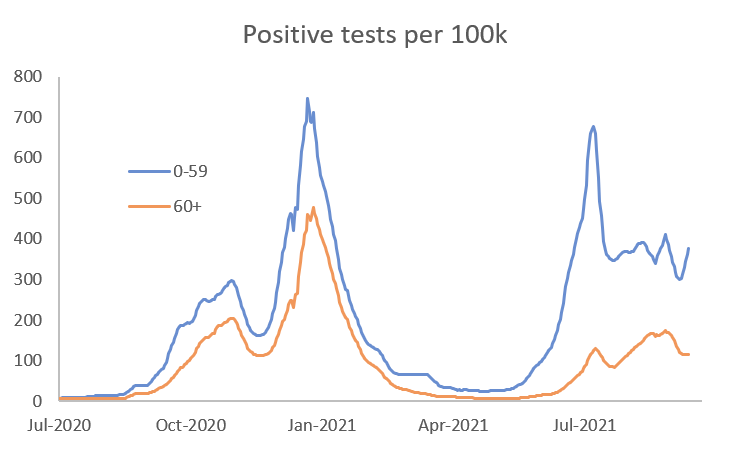
To put this in a broader context, the chart below shows the number of positive tests in England per 100k population for those aged under 60 and those aged 60+ since June last year, when widespread testing really began – the data shows a seven-day centred total.
As can been seen, in Wave 2 between October 2020 and March 2021, the incidence of positive tests was similar for both age groups. But more recently, the incidence of positive tests among the 60+ age group has been substantially below that of those aged below 60, largely due to the impact of the vaccination programme. On the face of it, at an aggregate level, the number of positive tests per 100k population has been fairly flat since early August.
Looking specifically at younger age groups within the 0-59 band, we can see quite different patterns emerging.
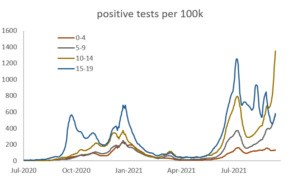
During Wave 2 in the Autumn of 2020 and the Spring of this year, the level of positive cases among the younger age groups, particularly those aged 0-4 and 5-9, was substantially below that of their older counterparts. But over the last six weeks or so, the rate for those aged 5-9 and also those aged 10-14 has increased considerably; the rate for those aged 5-9 is around currently 600 per 100k population, similar to that for all those aged 0-59 whilst the rate for those aged 10-14 is currently around 1300 per 100k population and has risen steeply since mid-August. The rapid increase occurred well before the return to school although it has continued and if anything accelerated since early September.
We can home in on the last two months to identify the trend more clearly:
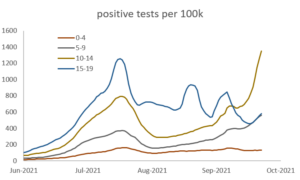
All these age groups showed increase in the number of positive cases following the easing of restrictions, with drops then occurring in late July and early August. Part of the drop is due to reduced levels of testing during the school summer holidays. But for those aged 5-9 and 10-14, the number of positive tests per 100k started to climb from around 8th August and then really started to take off from about 12th September, about a week after the return to school in England.
The PHE Weekly national Influenza and COVID-19 surveillance report confirms schools as sources of COVID-19 infection. The chart below, taken from the latest report, shows data up to week 37 – week ending 19th September.
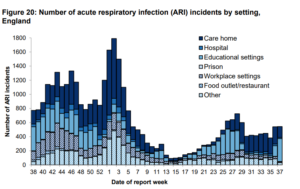
Weeks 30-35 cover the period 31st July to 5th September, broadly the school summer holidays in England. During this period there were virtually no infections from educational settings. For the last two weeks, however, the number of infection incidents (more than one infection in the same establishment) in educational settings has risen substantially with 324 in the last week compared to 189 in the three previous weeks combined (and most of these would have been in the previous week). During September, the number of incidents in educational establishments has been 20 in week ending 5th September, then 151 in week ending 12th September and finally 324 in week ending 19th September. To use an overworked term, this is exponential growth!
So clearly the return to school has seen a rise in positive tests among school age children, particularly those aged 10-14. About half of these will be eligible for a Pfizer vaccination in the next few weeks, although this will take some time to have an effect. We might therefore expect to see the number of positive cases among school age children remaining high for a month or so yet, until the impact of vaccination kicks in.
As yet, increases in positive tests among school age children does not seem to have generated a large rise among their parents, typically aged 30-50; indeed, as we have seen above, the rate of positive tests in the whole 0-59 age band has been fairly constant over the past two months so given the increase in children, rates among those aged 20+ must be falling in England. This group has substantial protection from vaccinations given between April and July, with a high proportion now being double jabbed, again suggesting the vaccination programme is having an impact on catching COVID-19 as well as in hospitalisation and mortality as confirmed in the article two weeks ago.
