13 January 2022
Lies, Damned Lies and Coronavirus
NHS absence
by David Chilvers

Happy New Year to all readers. As in the past, this column will continue to highlight issues with COVID-19 data and call out dodgy interpretations of that data. Over the Christmas and New Year period it has been difficult to evaluate trends due to reporting delays. The data relating to “date of reporting” is the most erratic, that relating to “date of test/death” less so, but this latter data takes several days or even weeks to be finalised.
Some of the data on numbers of positive tests (“cases”) will become even more difficult to interpret from now on due to changes in the testing regime. As we reported on 9th December, if your Lateral Flow Test generated a positive result, it was mandatory to take a PCR test and the results of all PCR tests were recorded and published each day. If you follow a positive Lateral Flow Test with a positive PCR test, only the latter was included in the published statistics; if you followed a positive Lateral Flow Test with a negative PCR test, the positive Lateral Flow Test was removed from the reported statistics. In short, the number of positive PCR tests reported was a good guide as to the total number of positive tests; and comparing positive cases reported to total PCR tests reported allowed an assessment of whether the positivity rate was going up or down.
This regime changed yesterday. If you have no symptoms and record a positive Lateral Flow Test result, you no longer need to take a PCR test; you isolate and take Lateral Flow Tests on days 6 and 7 and if these are negative you can end your isolation. So, the number of positive tests (“cases”) will now be made up of some PCR positive tests and some LFD positive tests. The number of positive PCR tests will do down compared to the previous regime and the number of positive LFD tests will go up. The positivity of PCR tests will drop as the new regime will exclude those with a positive LFD test who would have gone on to have a PCR test, most of which would have been positive. The positivity of LFD tests will go up, as those from asymptotic individuals will now be included rather than be replaced by a positive PCR test result. The total number of positive tests will be as before but the split by type will change and so will the positivity.
Up until now, the Government has not published the split of positive tests between LFD and PCR. If it does not do this it will be difficult to monitor positivity; if it does, it will need to provide a past history of data to enable new information to be interpreted properly. Whilst the change is probably sensible, it is likely to inhibit public understanding of what is happening to infection rates and my cynical side thinks this is deliberate obfuscation.
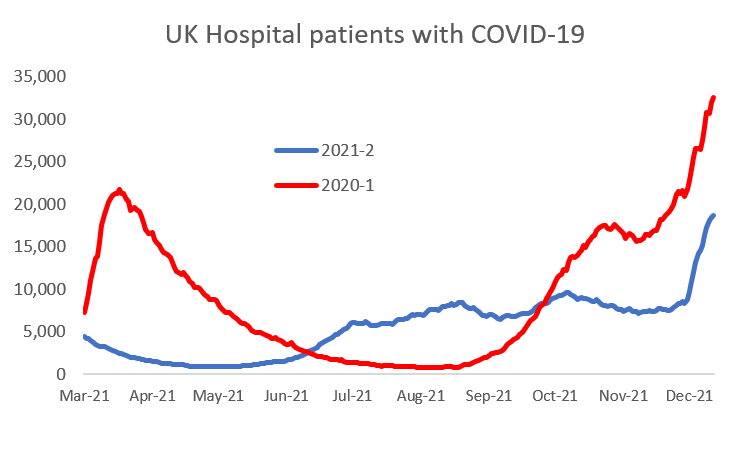
Anyway, this week I really wanted to look at the pressure on the NHS caused by the Omicron wave. The number of patients in hospital has been steadily rising since Christmas but is still below half the peak level reached in early 2021.

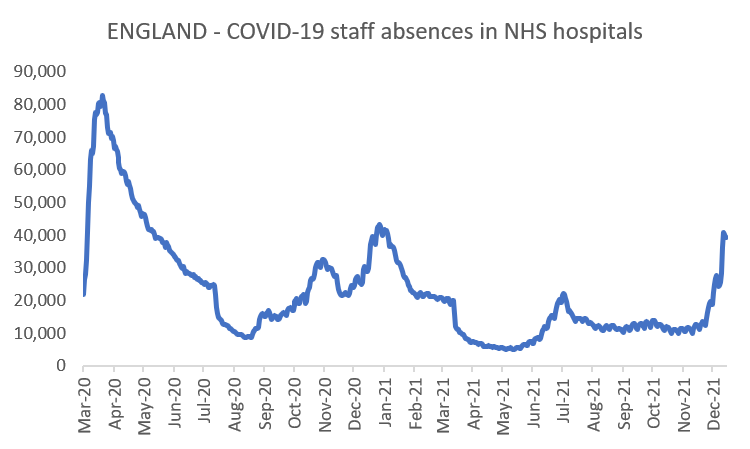
So, you might wonder why several NHS Trusts have declared critical situations. The apparent issue this time is that the increased infectiousness of the Omicron variant is having a large impact on NHS staffing levels. The latest weekly NHS England figures show almost half of all NHS absences in England were due to coronavirus, at 44 per cent, with more than 80,000 workers off each day on average for any reason (these are only published once a week so the latest data relates to early January). On January 2, 39,142 NHS staff at hospital trusts in England were absent for Covid-19 reasons, up 59 per cent on the 24,632 recorded for the same day a week earlier. Three weeks earlier, on December 12, the figure was 12,240.
Dr Chaand Nagpaul, council chairman of the British Medical Association, said: “We have never known this level of staff absence before.” As on several previous occasions, Dr Nagpaul has his facts wrong. The 39,142 absences due to COVID-19, either directly or from self-isolating on 2 January this year compares to 43,161 on January 14 2021, the peak of the second wave and to 82,819 on 7th April 2020, the peak of the first wave. These figures come from HSE’s own data but as with many sets of NHS data care needs to be taken in making the comparison. The data shown in the historic report referred to here covers 496 hospitals; the data currently produced covers only 138 of these, the difference being that the current data includes just English NHS hospitals whilst the historic data also includes figures from private hospitals and community hospitals. The comparisons I have made are on a like for like comparison, with the same NHS hospitals included in each set of data.
Here is the full picture over time:

So, absences are rising quite sharply but have just reached the January 2021 peak and are a long way away from the April 2020 peak. Why then are health managers talking again about unprecedented workloads when they handled twice the number of patients in hospital last year and in 2020 had twice the number of COVID-related staff absences? Is this more scare-mongering?
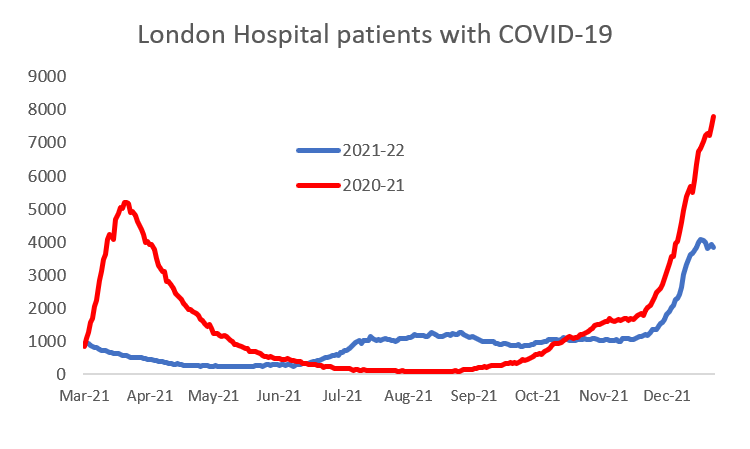
In fact, over the past couple of days, we have seen quite a bit of back tracking from NHS managers. Dr Richard Cree, a consultant at the James Cook University Hospital in Middlesbrough, had previously feared the number of patients being admitted would be higher due to the latest COVID variant and said most people who have needed specialist treatment are “relatively young and unvaccinated”. But he now says that “across the country, the number of people being admitted to hospital following infection remains high. However, the number of people being admitted hasn’t risen as high as I feared it might and it may even be starting to plateau”.
This is clearly the case in London, which was the original epicentre of the Omicron wave, as the data in the last couple of weeks in the chart below shows:

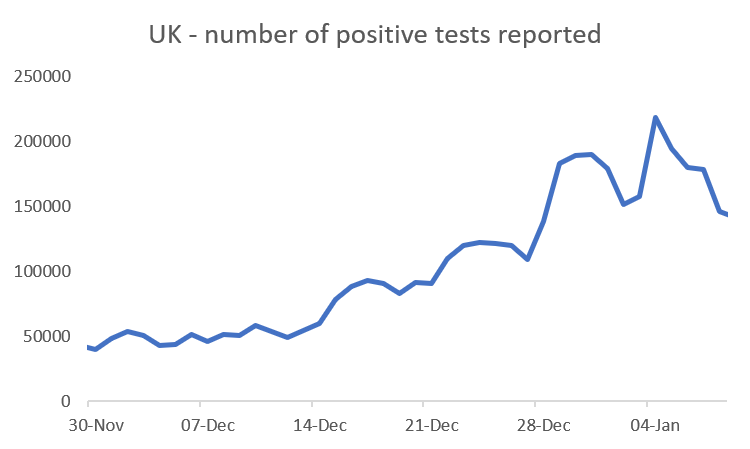
So, it does appear that the earlier calls of the NHS being overwhelmed by this latest wave have not been realised so far and on the basis of the trends seen and the revised comments made, are unlikely to be realised. It may be early days, but fears of any increased mixing during New Year celebrations leading to another spike in infections does not appear to have materialised. Here is the total number of positive tests (“cases”) recorded in recent days, showing the reductions, even though the number of tests has stayed relatively constant; the chart also confirms the erratic nature of reporting over the Christmas and New Year period.

Declining numbers of positive tests (“cases”), a start to a decline of hospital numbers in London and back-tracking by health professionals on the ability of the NHS to cope all suggest the beginning of the end. We have been close to this before in Summer 2020 and Summer 2021 and in each case a new wave followed some months later. The difference this time is that we are in Winter, when the virus should spread more quickly, society is fairly open and we have vaccine protection, including boosters; we shall soon find out if this positive view is the right one.
This article is one of a series, the previous article on the spread of Omicron is here.

