

9 December 2021
Lies, Damned Lies and Coronavirus
Unintended consequences
by David Chilvers

Since the start of the pandemic last year, we have used this column to highlight inadequacies in data relating to COVID-19 and to call out misuse of information. This week, we take a slightly different track – a column about how sensible changes in policy might lead to unintended consequences.
Government health advice on when to take a test has changed recently and people are now being urged to take a test ahead of mixing with others in “crowded indoor spaces” and before seeing anyone who is more vulnerable to the disease. The aim is to reduce the risk of infection in the run up to Christmas and the New Year. The new advice comes ahead of the busy festive period, when people will be spending more time seeing loved ones, out Christmas shopping or going to parties. The advice suggests “taking a free rapid lateral flow test before a period of high risk will give you peace of mind that you are unlikely to be infectious and able to spread Covid-19”.
This all seems very sensible and mirrors what many people have been doing of their own accord. We went to a birthday party in October, at an indoor location with many people we had not met for a long while. The host asked everyone to take a Lateral Flow test and to only attend if the test was negative. My son went to a wedding, where all guests were asked to take a test and, again, to only attend if the test was negative. So, this development is really formalising what a lot of people have been doing but on a larger scale.
In another development that will increase the number of PCR tests taken, all those entering the UK from overseas must take a PCR test by the second day after their return. If this test generates a positive result, you must isolate for 10 days. This development will also increase the number of tests undertaken.
However, increasing the number of tests undertaken increases the number of positive tests reported. If 100k people take tests who would not previously have done so and 1% test positive, that means 1,000 more reported positive tests than would otherwise have been the case. So, increased testing inexorably means more reported positive tests. Note this does not necessarily mean there is a higher rate of infection, rather that the higher level of testing has contributed to this result.
So, it is important to keep an eye on the level of testing that is taking place as a context for the number of positive tests reported. If you take a Lateral Flow test, you are meant to report the result on the NHS website. It is not a trivial task and I suspect that many people with a negative Lateral Flow test do not report it at all. As this is the source of the data on the number of tests undertaken each day, the number of Lateral Flow tests will likely be under reported. However, if your Lateral Flow test generates a positive result, it is mandatory to take a PCR test and the results of all PCR tests are recorded and published each day. If you follow a positive Lateral Flow test with a positive PCR test, only the latter is included in the published statistics; if you follow a positive Lateral Flow test with a negative PCR test, the positive Lateral Flow test is removed from the reported statistics. In short, the number of positive PCR tests reported is a good guide as to the total number of positive tests.
As previously highlighted, if testing activity increases, the number of positive tests reported will increase. In deciding whether the level of underlying infection is increasing, it is therefore important to compare the number of positive tests (all are PCR as described above) with the number of PCR tests undertaken and compute the ratio – the % of PCR tests which give a positive result. This is the only real guide as to whether underlying infections are going up, down or remaining broadly constant. Even this is not perfect as extending tests to largely asymptotic people is likely to produce a lower positivity percentage than is in the population at large; but it is better than just reporting on the number of positive tests with no context.
It is of course likely that the largely innumerate mainstream media (excepting the excellent Ed Conway on Sky) will report any increase in “cases” as evidence of a problem. Let’s assume that the underlying rate of infection remains constant. The result of increased testing will be an increase in the number of reported cases” – positive tests to be precise. So, a policy of increased testing to reduce infection will result in published statistics that appear to show increased infection, unless the context of the increased level of testing is included. This is an unintended consequence – let’s intervene to reduce infection and the published data, as a result, will show increased infection (assuming the real infection rate remains unchanged). You can almost see the headline now.
How is this manifesting itself in practice? This chart shows the number of positive tests each day since April this year – it is based upon the day of reporting, so we have omitted the last three days as these are often revised upwards subsequently.
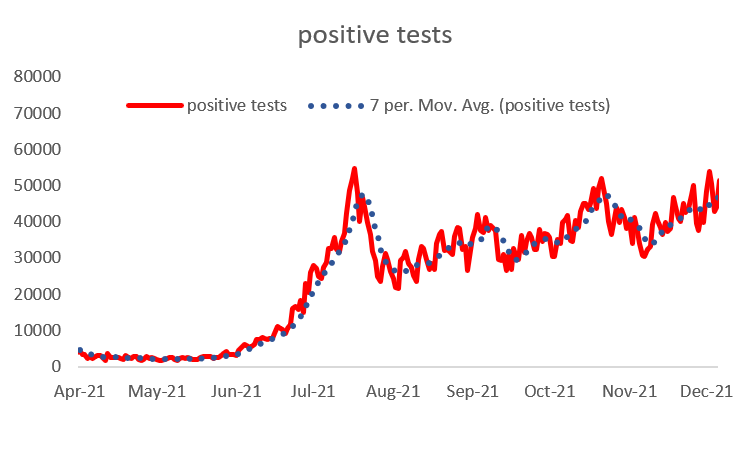
The number of positive tests increased as restrictions were unwound in the late Spring and early Summer and then dropped during the school summer holidays in July and August. Since the return to school the number of positive tests picked up and the underlying trend is gently upwards, but with lots of ups and downs around this.
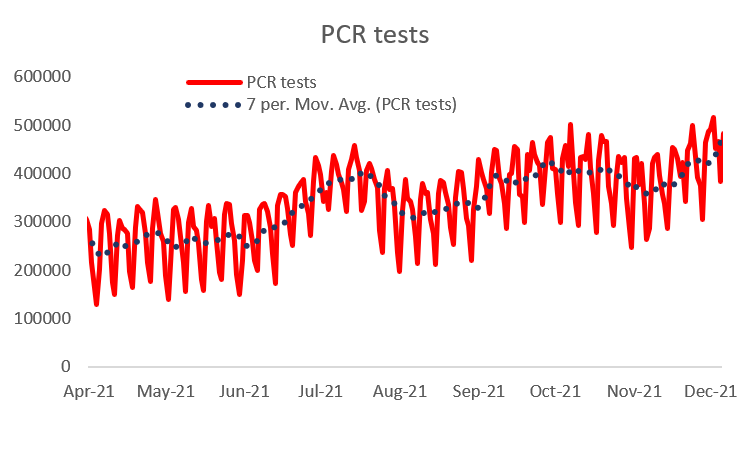
The number of PCR tests undertaken has followed a similar pattern since the end of August.
So, what has happened to the positivity rate – the % of PCR tests that have led to a positive test? As the chart below shows these have hardly changed since August, having gone up after restrictions were lifted in June and July.
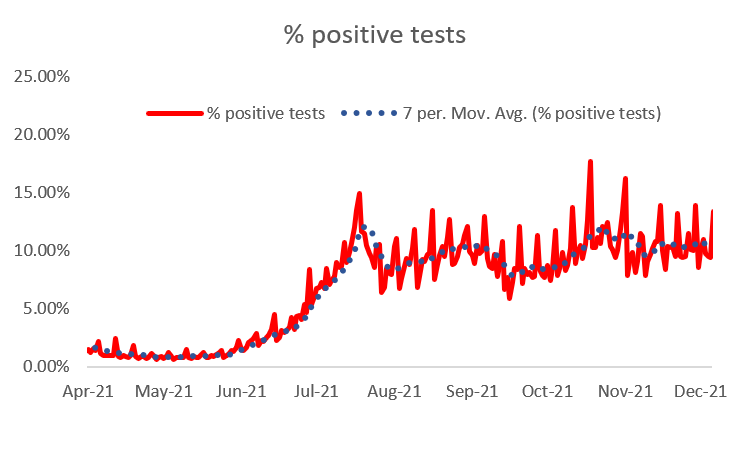
Increased “case” numbers (positive tests) could mean restrictions are re-introduced; if this was just due to increased testing, it would be the ultimate irony – unintended consequences indeed.
This article is one of a series, the previous article on wave 4 is here.
