

15 October 2020
Lies, Damned Lies and Coronavirus
The University Effect
by David Chilvers
 This week we look at the impact on COVID-19 infection rates of the return of students to schools and universities*. All of the data evaluated relates to England, where schools re-opened in the first week of September and universities towards the end of that month.
PHE produces a very useful weekly bulletin which does indeed show significant recent increases in positive tests among younger age groups, compared to the first wave which predominantly affected older people. In the chart below, week number 36 is the week ending 6th September and week number 40 is the week ending 4th October.
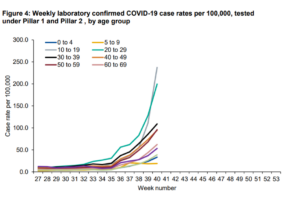
The grey line for those aged 10-19 has risen steeply during September – this age group covers secondary school and some university age groups. The rate for the latest week indicates around 16,500 positive tests among this age group.
The light green line for those aged 20-29 has been increasing over a longer period of time, since week 33 (week ending 16th August). So, this is not just a return to university effect, more likely an effect of returning or starting work after the gradual release of lockdowns and then accelerating during late September/early October. The rate for the latest week indicates over 15,000 positive cases among this age group.
Growth rates in all other age groups outside those aged 10-29 are also increasing but at much lower rates than among younger people and at nothing like the exponential growth of the two younger age groups. Around half of the positive cases in the latest week are in the 10-29 age groups (over 30,000 positive tests).
Amazingly, the chart this week does not contain the legend for the two oldest age groups – on the basis of the previous week, 70-79 year olds are represented by the pale green line which is third from the bottom in week 40 and the 80+ age group is the next line up – the purple line.
Bringing together large numbers of students inevitably increases the circle of contacts for individuals and the likelihood of infection was bound to increase, as the chart below shows:
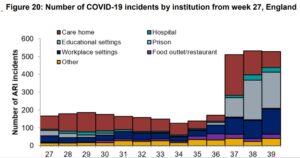
Week 36 is week ending 6th September, which is the first week pupils were back at school. By the next week, educational settings had become the largest source of COVID-19 incidents, defined as at least two or more test-confirmed positive cases in the same institution. The PHE report used to break educational settings down into primary schools, secondary schools and universities, but just as university students return, this breakdown has been removed from a new version of the report.
So, to try and generate evidence on the university effect, we have looked at the local area data published on the coronavirus website. This data includes a table, updated each day, of the number of positive cases in each Middle Level Super Output Area (MSOA), of which there are 6791 in England with an average population of 8,236 individuals.
The site also includes a map and I was surprised in scanning through the areas of high incidence on the map that many of them contained “University” in the name of the MSOA. So, I highlighted all the MSOA’s in England with “University” in their name – there are 24 of these – and compared the average cases per MSOA of this group of 24 with that of all the other MSOA’s. The results are quite startling:
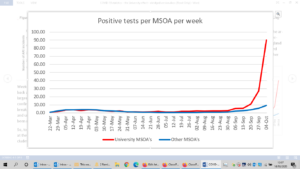
Until the end of August, the two groups had similar numbers of positive tests each week. In early September, there were a few more positive tests in the University MSOA’s and this widened more in the week ending 27th September and really shot up in the following week. In that week, there were 81 more positive cases per week in University MSOA’s than in other areas (which would also have included other university populations and so the real baseline for MSOA’s without universities would be lower and the gap wider). In the latest 7 days (up to 8th October) the gap increases to just over 100.
As an illustration of how this “university” effect impacts on the overall number of positive tests, we have looked at Nottingham, where the number of positive tests has increased substantially in the past couple of weeks. There are 36 MSOA’s in the Nottingham City area. The two MSOA’s with the greatest number of cases are University Park, Lenton Abbey & Jubilee Campus with 651 positive tests in the past seven days and Arboretum, Forest & Trent University with 501; this compares with the average MSOA in England which as highlighted above has 9 positive tests in the same period.
These two MSOA’s, incorporating the two university campuses in Nottingham, represent 44% of all new positive tests in the past seven days. The surge in positive tests in Nottingham is clearly being driven by the return of university students at the end of September.
To look at the overall national effect, the 1.54 full time university students represent the population of just under 200 MSOA’s and applying this to the 81 gap between university MSOA’s and others leads to an estimated 16,000 positive tests amongst university students in the week ending 3rd October. This is around 20% of the total positive tests and consistent with the number of new cases among the relevant age groups.
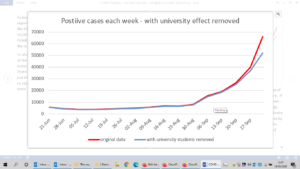
To show how the migration to universities might have affected the growth of the virus among the rest of the population, I have removed the estimated number of university students affected from the totals each week. There is still growth, but the steepness of the growth is reduced; and this is just looking at the week ending 3rd October, when universities were just re-starting. As the weeks go by, we might expect the impact of this segment to affect the overall data even more.
This week, the Government has introduced further restrictions in areas of high infection, including shutting down much of the hospitality industry. If much of the increase in the infection rate was due to the return of university students, this might not be the best strategy; an alternative strategy, with less impact on the economy, might be to allow the hospitality industry to continue to operate, with all the excellent steps that have been taken by many establishments to provide safe environments and to limit the mingling of students with the rest of the population, at least for a couple of weeks to drive down infection rates.
This article is one of a series, find last week’s article “The Second Wave” here.
