

23 June 2022
Lies, Damned Lies and Coronavirus
COVID update
by David Chilvers

We have not looked at COVID statistics since early May and you might be forgiven for thinking that the disease had vanished off the face of the earth. This is partly due to media concentration on other stories – the war in Ukraine, partygate, immigrants to Rwanda and the national rail strikes – but it is also as a result of deliberate Government policy.
The current strategy is to “live with COVID” and let as much as possible of normal activity to take place. This is commendable given the vaccination and treatment regimes now available. But it is also part of Government policy to reduce the quality and frequency of publishing data, which is being applied in several areas, from COVID to immigration. Whilst this saves money, without data there are no stories and without stories there can be no bad news, a state of affairs which George Orwell would recognise.
COVID statistics have been gradually downgraded. In the early part of this year, the Coronavirus website data stopped publishing data at weekends. From 1st July, the frequency will be reduced to weekly. The data on “cases” is now worthless as the introduction of payments for lateral flow tests reduced the number of tests undertaken, as per the chart below:
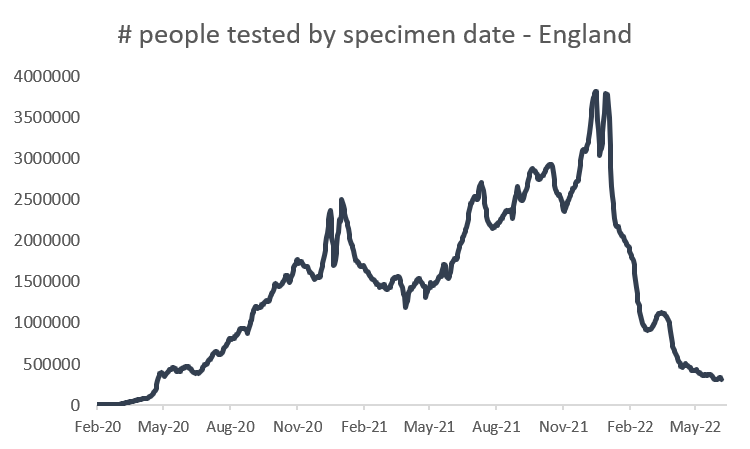
This data is for England only as, in another degradation of information, UK data is only available until 19th May, when the series stops with no explanation on the website. From a peak of nearly 4 million tests a day in early January this year, the number has steadily reduced to around 300,000 a day now. From an expenditure perspective this is good, as tests cost around £5 each; it was not sustainable to be spending £20 million a day on testing for a single disease which has clearly reduced in its impact due to vaccination, inherent immunity, better treatments and variants with less impact in terms of severity.
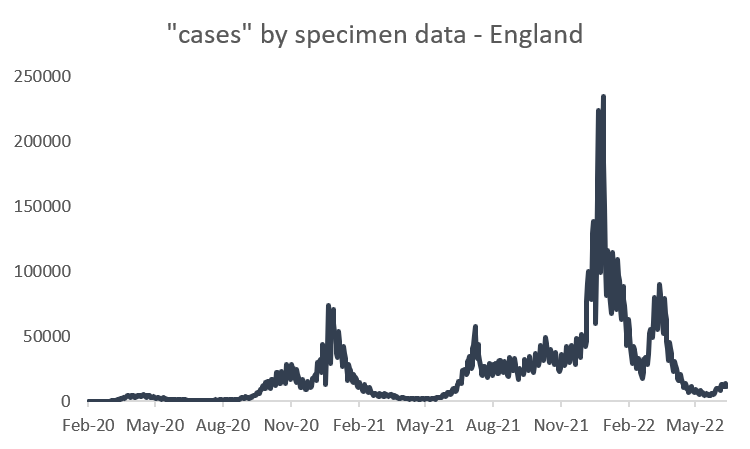
However, reducing testing means that the level of infection is difficult to assess from the Governments daily data. Even so, the number of “cases” resulting from the testing programme appears to have been increasing in recent weeks:
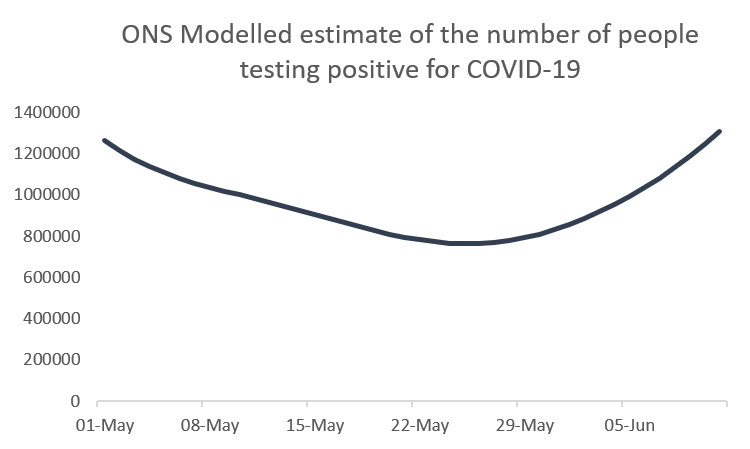
The Office of National Statistics weekly survey confirms this recent upward trend. The ONS data comes from a large random sample of households and so is not subject to the vagaries of the level of testing being undertaken.
So, there has clearly been an upturn in infection levels since early May. Should this cause any concern, given the impact of vaccinations and treatments on reducing severe disease? Are the numbers of COVID patients going to hospital and being in hospital going up in line with these increased infection levels? Indeed, they are:
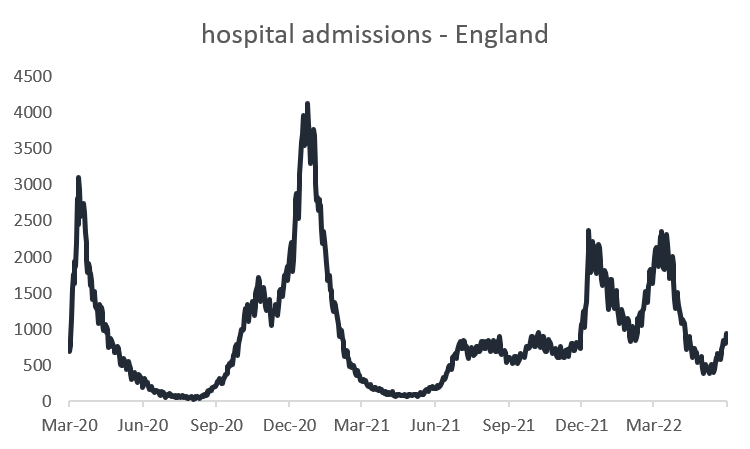
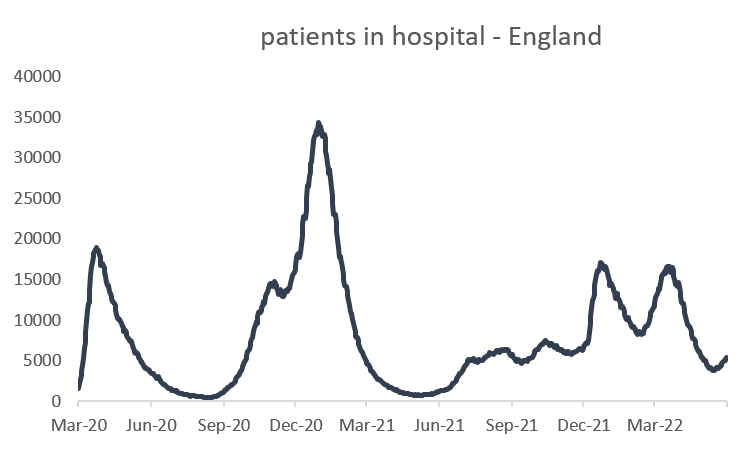
As yet, these are small increases but a comparison with the low points of this year is interesting:
Admissions 21st May 387
Admissions 19th June 942
In hospital 1st June 3800
In hospital 21st June 6002
Since the low point of admissions on 21st May, the number of COVID admissions has gone up by 143% and since the start of June the number of COVID patients in hospital has gone up by 58%.
Is this what would normally happen in Summer with a respiratory disease? In 2020, the number of patients admitted to hospital reached a low in late August, in 2021 it was in May and in 2022 again in May. In 2020, the first lockdown only ended in May and the lifting of restrictions was very slow. In 2021 restrictions began to be unwound in May and were pushed further in June, so in effect there was little intervention in terms of restrictions. This year, of course, there are no restrictions.

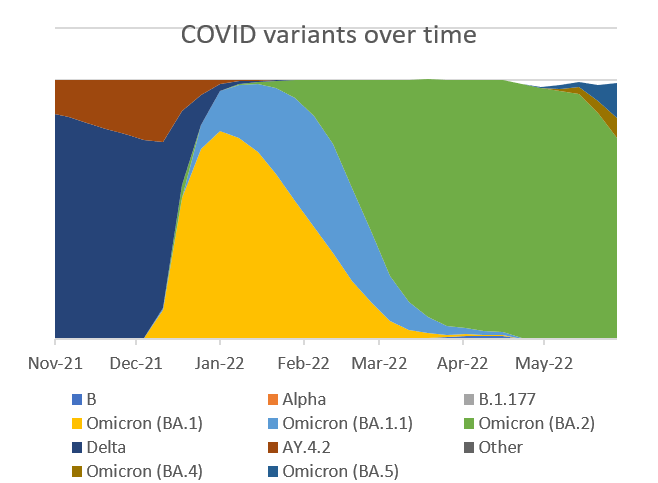
So, in the absence of restrictions, it seems that hospitalisations increase from late May onwards and this year the levels are at about five times what the minimum levels were in 2021. As can be seen from the charts above, in 2021 admissions and patients in hospital increased slowly but steadily until late November, when the emergence of the Omicron variant had a quick and large impact on numbers. Could a new variant do the same in 2022? According to the latest data, two new variants (Omicron BA.4 and BA.5) are already here and starting to replace previous variants.
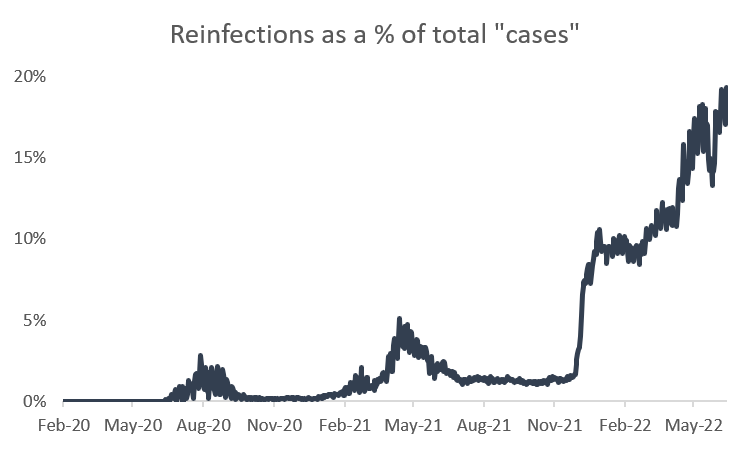
Reinfection rates (the % of “cases” that have previously had COVID) are the highest they have ever been and increasing sharply, although given that it is hard to find anyone who has not had the disease, this is perhaps inevitable (if everyone had caught COVID, the reinfection rate would be 100%).
So, should we be worried? The mainstream media clearly are not, given their fixation with just one or two major stories every day. But this is worth keeping an eye on, although made harder by the reduction in data quality and frequency. We will keep looking at this even if other media titles do not.
This article is one of a series, the previous article on “are we spending enough on health” is here.
