
5 May 2022
Spreading the Net
Lies, damned lies and coronavirus.
By David Chilvers

We have been reporting on COVID statistics for nearly two years now. During this time, the quality and breadth of data regarding COVID-19 improved significantly until a point a few weeks ago when things went into reverse. The introduction of a fee for Lateral Flow tests has helped the numbers of tests taken to decline substantially and the regularly daily data updates are now not produced at weekends. This has meant that data on “cases” has become next to useless and, as the Omicron wave begins to subside, the harder metrics such as hospital admissions, number of patients and deaths have all started to fall.
COVID-19 has become part of our normal life, with people still taking sensible precautions, but to all intents and purposes the pandemic has ceased to be news. There may be a point when that changes but at present there are only occasional interesting stories to write about the subject.
Given these changes, this column has decided to expand into looking at health statistics more generally. There are lots of potential investigations worth undertaking into the information that is used to monitor, guide and develop the NHS and health more generally. So, we will continue to dig, probe and hopefully uncover issues which we feel are important but other media fail to convey to people.
From time to time, there is likely to be an interesting COVID story emerge and when this happens, we will continue to cover it. One such example recently was in an ONS report which provided estimates of the cumulative impact of COVID-19, the number of people who have had the virus since this all began in early 2020. I was quite surprised by this data as although nearly everyone I know has someone in their family who has had the virus this year, I was not aware that over 70% of the UK population had been infected since the pandemic started.
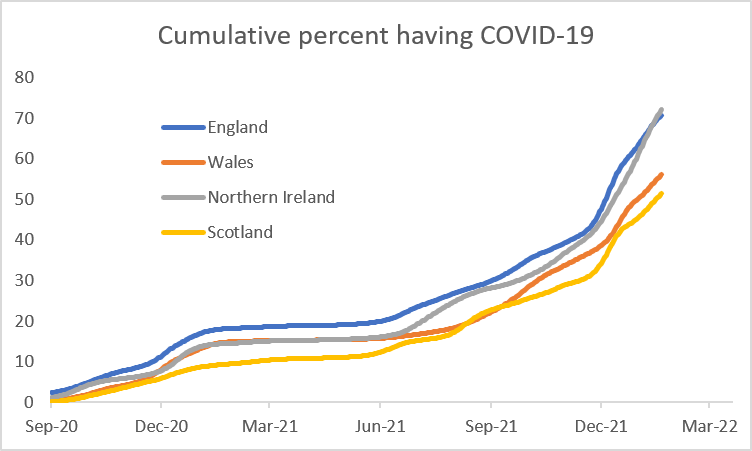
For each country, the cumulative figure for 11th February 2022 is as follows:
| Country | cumulative % |
| England | 70.69 |
| Wales | 56.05 |
| Northern Ireland | 72.22 |
| Scotland | 51.48 |
These estimates come from the ONS Weekly Infection Survey which uses a large random survey to generate its figures. The methodology is not tainted by the factors that are behind the apparent fall in “cases” on the daily data and should be sound. So why would the cumulative figure be above 70% in England and Northern Ireland but only just over 50% in Scotland and Wales? We know the latter had more severe and longer lasting restrictions than England and Northern Ireland but can this explain a 20% difference in the cumulative infection rates?
The gap has existed for England since early 2021. For Northern Ireland, cumulative incidence was similar to Wales until September 2021 and then went a bit ahead. But the real acceleration has been this year with the gradient of the curve being much steeper for England and Northern Ireland over the past few months. This coincides with the spread of the Omicron variant so the insight seems to be that Omicron affected England and Northern Ireland far more than in Scotland or Wales.
Does this difference in infection feed through into different rates of hospitalisation? The table shows the number of COVID hospital patients on 1st January and on 1st April, the increase and the percentage this is of the 1st January figure.
| Country | 01-Jan | 01-Apr | Increase | % |
| England | 546,288 | 683,225 | 136,937 | 25% |
| Wales | 37,572 | 40,221 | 2,649 | 7% |
| Northern Ireland | 15,755 | 19,620 | 3,865 | 25% |
| Scotland | 43,791 | 58,984 | 15,193 | 35% |
For Wales, the lower incidence of cases and the flatter increase this year does seem to correlate with a lower increase in the number of COVID patients in hospital. But in Scotland, a lower incidence appears alongside a higher growth in the number of COVID hospital patients. So, some evidence linking lower cases with lower hospitalisations but only in Wales. But in Scotland, some other factor must be behind the increasing level of hospitalisations compared to the rest of the country. This might be lifestyle, it might be demographics, it might even be different ways of collecting the data.
I started this article by saying I would be diversifying into health statistics outside the COVID area and have spent quite a bit of space not doing that. So, I want to leave you with a conundrum that presented itself with some recent health news, which will be investigated much more thoroughly in the next article.
You will doubtless remember the rapid construction of the Nightingale hospitals in 2020 and the lack of use of them for treating anything other than a handful of COVID patients. The conclusion was that the NHS is resource-constrained for staff – it takes at least three years to train a nurse and at least five to train a doctor and so you can’t suddenly increase the supply of staff. Prior to Brexit it was possible to use immigration from the EU to plug some of the gap but this strategy is no longer available as a short-term fix. So, the view at that time was the Nightingale hospitals were not used as there were no staff to work in them.
I was therefore surprised to see last week that two NHS Trusts opened radiology facilities and cataract operating theatres in their grounds and fully staffed them. So, is the NHS resource-constrained or not? And if it is, for what use can additional short-term funds be applied? Again, this can’t be on additional permanent staff as it takes too long to train them, so are additional funds just spent on increased use of locums and agency staff? Or on management posts, which can be filled from outside the health sector?
We will dig into this and hopefully provide some answers which will help understand a bit more about how NHS funding works, where the money goes and how quickly additional funds can be utilised to deal with urgent problems such as ever-increasing waiting lists.
This article is one of a series, the previous article on “where are we” is here.
