
3 June 2021
Lies, Damned Lies and Coronavirus
Roadmap or roadblock?
by David Chilvers
 Fierce debate continues around whether the final stage of the exit from the lockdown can take place as originally anticipated on 21st June (actually, the commitment was not before 21st June but that seems to have been lost in all the excitement). On the one hand, Conservative backbenchers are insisting that all restrictions should go whilst on the other hand most of the scientists on SAGE, SPI-M and NERVTAG are much more nervous and many are pushing for a delay of a few weeks. The general argument amongst the scientists seems to be that the cost of a few more weeks delay is small compared to the risk of going too early and letting the virus take off again. So, a roadblock instead of proceeding with the roadmap.
Some scientists have even talked about a third wave; Prof Ravi Gupta, from the University of Cambridge, said although new cases were “relatively low” the Indian variant had fuelled “exponential growth”. He said ending Covid restrictions in England on 21 June should be postponed.
We have commented before on the misuse of the term “exponential growth”. The chart below shows the number of positive tests (cases) in the UK since 1st March.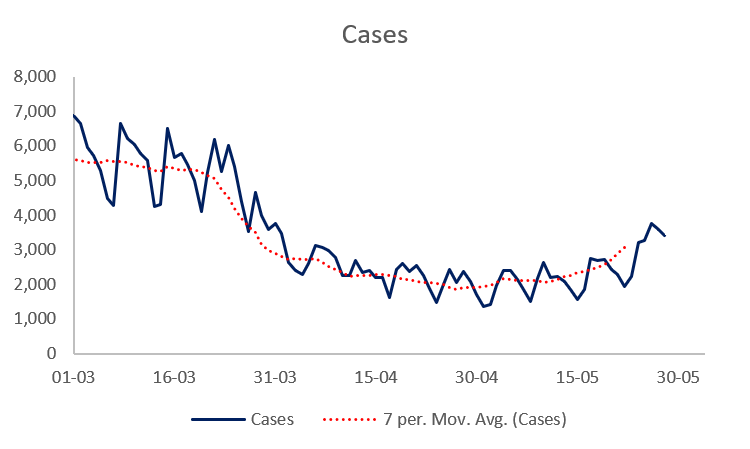
Cases plateaued in mid-March, probably as a result of the return to school on 8th March. There were then two weeks of steady falls, with another plateau in early April, several days after the 29th March relaxations. Cases were then fairly steady until mid-May, since when there has been a small upward trend following the third set of relaxations on 17 May.
This pattern is as would be predicted; at each stage of relaxation of restrictions there has been either a halt in the previous fall or a small rise in cases, entirely consistent with increased social interaction. The relaxations of 17th May were the most substantial, involving outdoor groups of 30 and indoor mixing in groups up to six. It does not therefore seem a surprise that the increase in cases which has occurred since then has been more pronounced that any effect from the first two stages of relaxations, yet it is still very small. And of course, we have had the Indian Variant of Concern, which has caused spikes in a small number of areas, as we highlighted last week.
But does the pattern in this chart look like exponential growth, where the case rate is doubling every few days? It doesn’t look like that to me and in fact the daily figures show falls from a peak on 26th May (I have not included the last few days as these generally are revised upwards)
| Specimen Date | Cases |
| 28/05/2021 | 3,418 |
| 27/05/2021 | 3,583 |
| 26/05/2021 | 3,753 |
| 25/05/2021 | 3,256 |
| 24/05/2021 | 3,207 |
| 23/05/2021 | 2,224 |
| 22/05/2021 | 1,930 |
| 21/05/2021 | 2,282 |
| 20/05/2021 | 2,427 |
| 19/05/2021 | 2,708 |
| 18/05/2021 | 2,703 |
| 17/05/2021 | 2,757 |
We noted last week that a lot of the growth in case numbers was clustered into a small number of areas, principally Bolton, Blackburn with Darwen and Bedford. So, have a lot more areas suddenly become places where the new variant has taken off?
The chart below shows the percentage of the Medium Level Super Output Areas (MSOA’s) that had three or more cases each week since the start of 2021. MSOA’s are the smallest area for which the Government publishes data and any area with two or less cases has its data suppressed.
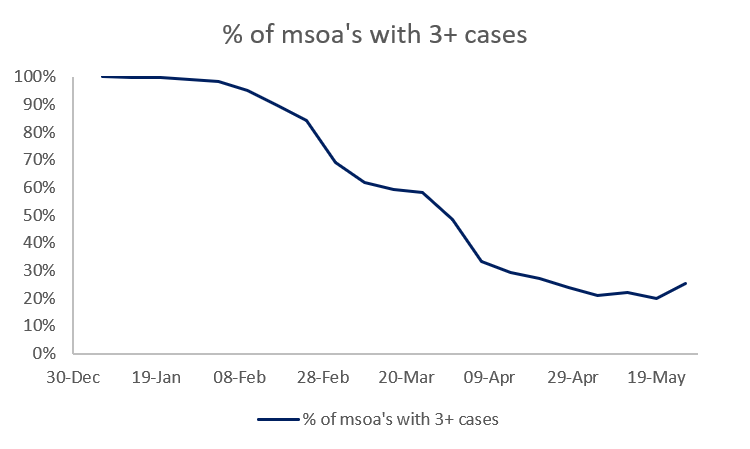
You can see that back at the start of January, there were three or more COVID cases in a week in virtually every MSOA in England and Wales. From early February onwards the percentage fell steadily to reach a low point of just over 20% in late April. Since then, the percentage has not varied much, being between 20% and 25% in each of the last five weeks. So, no evidence here of a large increase in the number of local areas where cases have taken off.
As regular readers will know, I live in Chelmsford and was disturbed to see the city declared a hotspot for the Indian Variant of Concern. The BBC News website on 17th May contained the following:
Most of the cases of the Indian Covid variant found in seven households in Chelmsford are not linked to foreign travel, a council has said. The Essex city is one of 86 local authorities with five or more confirmed cases of the variant. Essex County Council said it was “likely the variant is present in the community”. Director of public health for Essex, Dr Mike Gogarty, said the new variant “proves we can’t let down our guard”.
A week later on 25th May, Brentwood Live reported:
The Indian Covid variant remains the dominant strain of the virus in Chelmsford, the latest figures show. The strain made up around two-thirds of all coronavirus cases in the city in the week ending May 15, according to new data published by the Wellcome Sanger Institute.
Two thirds of cases sounds like a lot until you realise that in the week ending 15th May, there were 17 cases in Chelmsford and so two thirds would have been perhaps 12 cases, in a week, spread across a city of 170,000 people, an overall infection rate of 10 per 100,000 people and 7 per 100,000 with the Indian Variant of Concern. This variant is meant to be more transmissible than previous variants, so you might expect to see case numbers rocket upwards in Chelmsford from this small base. The chart below shows what has actually happened:
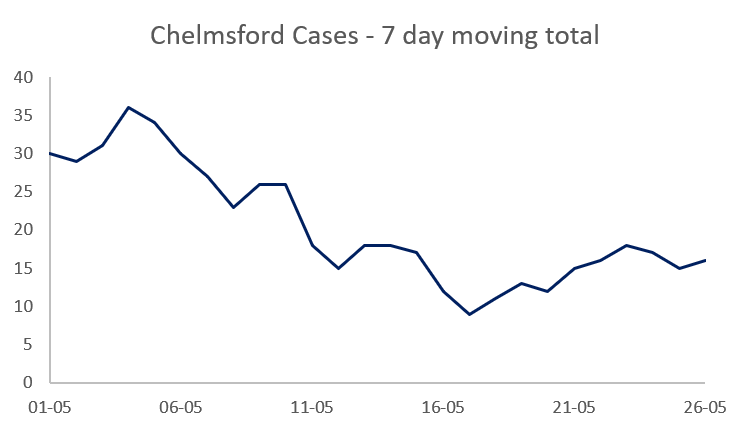
So, to summarise the situation in this COVID hotspot, where the Indian Variant of Concern has generated mass testing in a couple of schools and the variant is in the community causing concern we see: nothing, no effect, zilch.
My point here is that the media generate stories which bear little relation to the truth and appear to cast doubt on what the data is really saying. To me, it seems that the three stages of the relaxation of restrictions have had the impact that would be expected, with cases plateauing or going up a little when a relaxation generates more social interaction. The Indian Variant of Concern appears to be most prevalent in a small number of areas and whilst it has spread to many more areas, the experience in Chelmsford suggests that this is modest and not exponential growth nor the start of a third wave. And all the time, the vaccine rollout is reducing the number of people whom the virus can badly affect, with all indications that all those aged 50+ wishing to have vaccinations will have their second jab by 21st June. Given that, doesn’t the evidence point towards adhering to the original roadmap rather than setting up a roadblock?
This article is one of a series, last week’s article on a possible Indian Summer is here.
