

22 October 2020
Lies, Damned Lies and Coronavirus
A breaking wave?
By David Chilvers
 For my sins, I live in Essex, a lovely but much maligned part of the world. We achieved a new claim to fame last week when Essex County Council became the first local authority area to ask to be placed in a higher tier of coronavirus restrictions; the Government duly obliged and from midnight last Friday Essex is in Tier 2, which involves no household mixing in indoor spaces.
In a statement on the council’s website, leader David Finch said: “We think the government has decided correctly and been guided by the science. The fact is that the number of cases in Essex is rising exponentially”. The council seems to have been guided by Dr Mike Gogarty, Director of Public Health and Wellbeing at Essex County Council. In a press release on 7th October he said: “Sadly we are starting to see faster and faster increases in cases in many areas of Essex. They are now showing exponential increase, so are doubling every few days”.
Both of the statements in this last sentence are not so. Regarding exponential growth, Wikipedia has a useful chart showing the difference between exponential growth, power (or cubic) growth and linear growth:
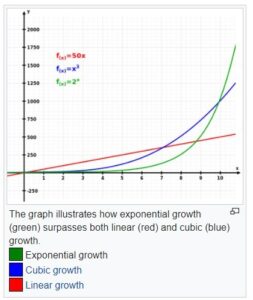
Exponential growth means that the growth rate in the number of cases is at least stable and probably large and increasing. With linear growth, the number of cases increases by the same amount each day and the growth rate is declining. Cubic (or power) growth is somewhere in between.
The data for positive tests in Essex shows the following trend. This is somewhere between linear and power growth and nowhere near exponential growth. This chart only uses data to 7th October, as recent data on case numbers tends to understate the total, due to the time taken to report back results.
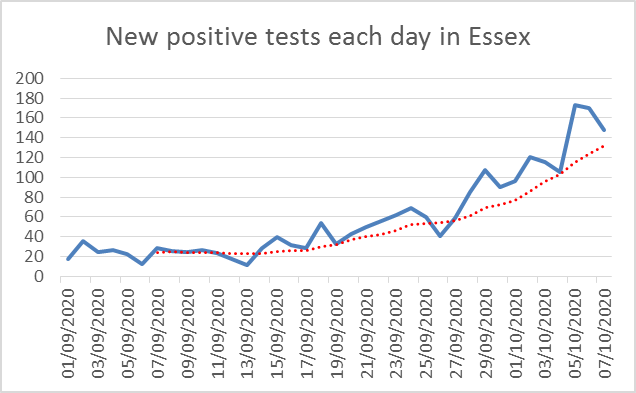
The dotted red line is the centred seven day moving average, which is moving gently upwards. The average daily growth rate over the latest week for which there is reliable data is 6%, and was 9% in the previous week. So, the growth rate is actually falling over time, confirming that there is no exponential growth.
Neither are cases doubling “every few days in Essex”. To double every two days requires an average daily growth rate of 41%, to double every three days 26% and to double every week requires an average daily growth rate of just over 10%. The growth rate in Essex currently at 6% implies positive tests doubling every 10 days last week.
So, the claims made by Dr Gogarty are not supported by the evidence and Essex has been unnecessarily placed in Tier 2, causing loneliness and depression and significant harm to local businesses, both those in the hospitality sector and in the supply chain supporting that sector.
Nationally, the daily growth rate in number of positive cases is also starting to slow down and was just over 2% in the week ending 16th October; the corresponding figures for hospital admissions and deaths were 4% and 8% and as we know these will lag the growth in positive tests.
In the Coronavirus press briefing yesterday, Professor Jonathan Van-Tam showed a number of charts including the one below, which shows how positive tests are changing over time, for various age groups and in each region.
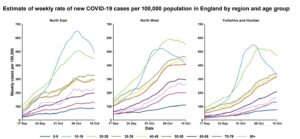
In the North West, which has just been placed into Tier 3, the number of new positive cases per 100,000 is declining in the 10-19 and 20-29 age groups and stabilising in the other age groups, including the oldest, most vulnerable members of society. The pattern in the North East is broadly the same. In Yorkshire and Humberside, the trends for the younger age groups are the same but for older age groups rates are still increasing and are possibly a week or so behind the other two regions.
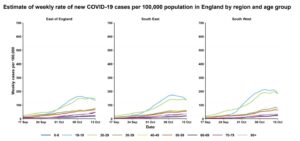
In the three regions in the south, the same pattern persists but at much lower levels, with no evidence of rapid growth among older people.
The only exponential growth is in local areas around university campuses, as we demonstrated last week; but here, growth rates are now declining as data for the latest seven-day period shows – updating the chart shown last week with a couple of more recent data points:
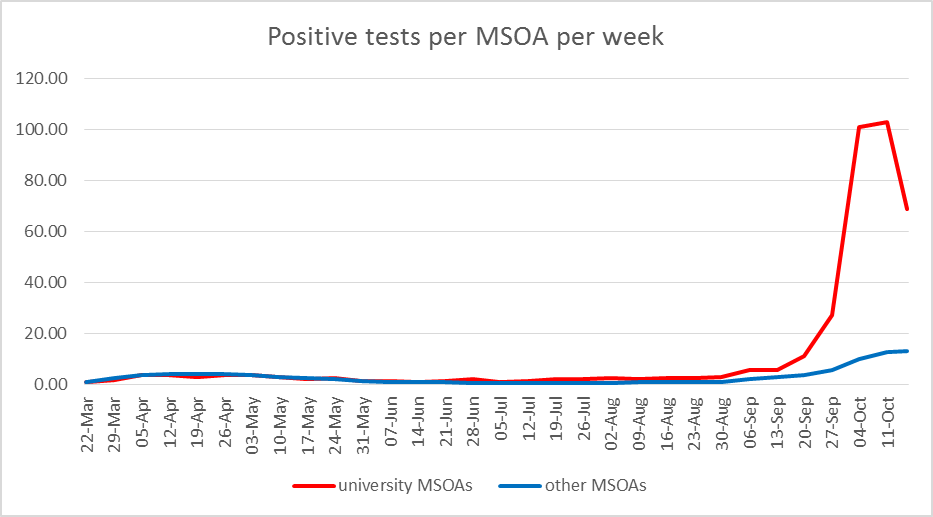
Some of the surge in university cases may have been driven by increased rates of testing. But the key line is really the line for other MSOAs (which as mentioned previously will still include data from the 100+ universities not in the 24 MSOAs with “University” in their name). This line shows a gradual increase and now levelling off in growth – further suggesting that the current wave may be slowing down.
Why might this be? As we have indicated, much of the growth in September appears to be due to the re-opening of schools, most of the growth in early October appears to be due to 1.5 million students going or returning to university. Both of these drivers of increased infection appear to be of declining importance, probably due to all the efforts by those in the educational sector to contain transmission of the virus. There have been increases in positive cases in older age groups and these inevitably lead to increased hospital admissions and sadly deaths a few weeks later. But the evidence in the North West and North East is that infection rates are already slowing down, probably due to the existing restrictions and the heighted awareness among the public (particularly older individuals) to observe the social distancing and hygiene measures. But just as this happens, we appear to be tightening the screw with greater restrictions and the impact this will have on businesses, jobs, isolation and loneliness and increasing poor health outcomes outside coronavirus. And in Essex, with even less justification than elsewhere.
*This article is part of a series, find last week’s article “The University Effect” here.
