
25 November 2021
Lies, Damned Lies and Coronavirus
Wave 4 or not?
by David Chilvers
Over the last couple of weeks, it has been evident that the number of positive tests – “cases” – has been accelerating in a number of Western European countries. In Austria, a full lockdown began this week with the announcement that all citizens must be vaccinated by 1st March. Austria is the first country to force its population into compulsory vaccination, a decree which is likely to contravene a large swathe of human rights legislation.
In a number of countries, the loosening of restrictions is being put into reverse gear with, for example, Champions League football matches being played behind closed doors. What has led to this turnaround is a rapid increase in the number of cases particularly in the last 2-3 weeks. All our data this week come from the Our World in Data website which contains information on positive tests – cases – deaths and vaccinations on a daily basis since Spring 2020 and which is updated every day..
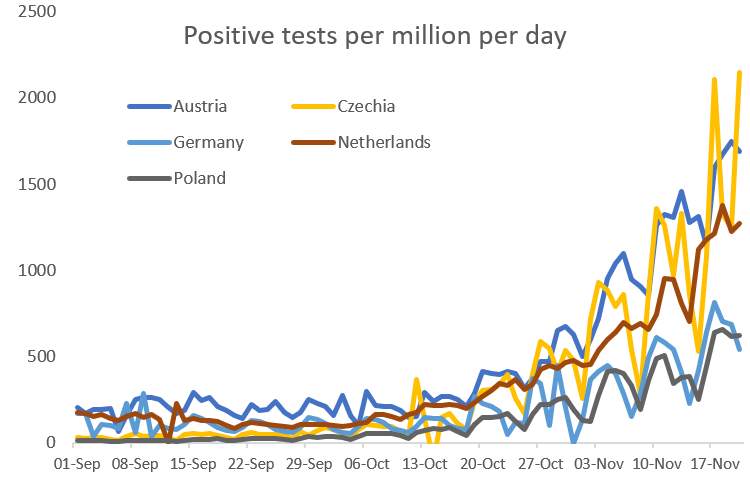
The chart below shows the number of positive tests per million for five countries where rates are on the increase, but these are by no means the only examples. What characterises this chart is the low level of positive tests per million population during the summer followed by a sharp rise since late October. Austria, Czechia and the Netherlands show the largest rises but Germany and Poland are also following a similar pattern at a lower level.
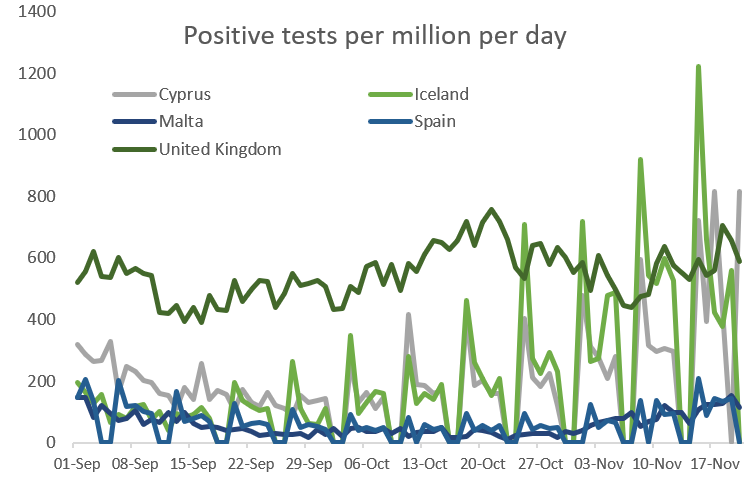
At the other extreme are a group of countries where there has been only a small rise or no rise at all. Iceland and Cyprus show spiky charts, largely due to the fact that data is not reported every day, but for these countries there is a gentle underlying rise. Malta, Spain and the UK show no real increases, although the UK has been running at steady high levels of around 600 positive tests per million for some time.
The total number of positive tests per million of these countries is shown in the table below. The first column has the total number of positive tests per million population from 1st September to 16th November; the second column shows what % of the total from 1st July to 16th November that figure represents. Given there are 77 days from 1st September to 16th November and 139 from 1st July to 16th November, if the number of positive tests was flat, we would expect about 56% in the period from 1st September onwards.
| Country | Since 1-9-21 | % last 2 months |
|---|---|---|
| Poland | 9,047 | 97% |
| Czechia | 21,301 | 95% |
| Austria | 32,467 | 88% |
| Germany | 14,054 | 83% |
| Netherlands | 23,209 | 60% |
| United Kingdom | 42,005 | 58% |
| Iceland | 15,083 | 55% |
| Malta | 4,162 | 27% |
| Cyprus | 14,205 | 25% |
| Spain | 4,406 | 16% |
As can be seen, for Poland, Czechia, Austria and Germany the percentage is above 80% and indeed above 90% for the first two countries. This confirms the rapid acceleration in the number of positive tests for these four countries. For Spain, Cyprus and Malta, the percentage is considerably below 56% and this confirms the tailing off in the number of positive tests in these three countries. For the Netherlands, UK and Iceland, the percentage is close to the level figure but for the Netherlands the earlier chart confirms the rapid rise in recent weeks, whereas for Iceland and the UK the figures are broadly flat.
The five countries in the first chart above are not the only countries with rapidly increasing numbers of positive tests with Hungary, Slovakia, Romania, Slovenia and Croatia all showing more than 90% of their positive tests since 1st July in the past two months. It can be no co-incidence that these countries together with Austria, Czechia, Germany and Poland are geographically adjacent.
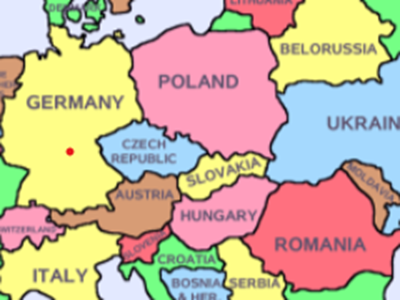
The nine countries listed are shown in this map, from Germany in the West to Romania in the East, Poland in the North to Croatia in the South. All are in the EU and have no borders, allowing freedom of movement between all these countries. So perhaps this freedom is one factor leading to the rapid growth of positive cases in the last two months.
The UK is an outlier in this analysis – high numbers of positive cases but no dramatic growth in recent months. Why might this be?
One reason could be that the UK ended most restrictions on July 19th, the only remaining constraints being that visitors from red list countries needed to quarantine and mask wearing was required on public transport. The red list has gradually shrunk and mask wearing on buses and trains reduced, even though the companies operating the services still insist on the use of masks. Opening up in the summer did increase case numbers a little but in other countries opening up occurred much later and into the autumn, with more indoor socialising. Could the early opening up in the UK have led to higher numbers of positive tests in the summer but then no increase in the autumn as the restrictions had already happened. Contrast this to most countries in Europe where the end of restrictions coincided with onset of Autumn.
The second possible reason for the UK’s outlier performance could relate to the initial vaccine rollout. Unique among countries, the UK adopted an initial 12 week gap between jabs, subsequently reduced to 8 weeks; this compares to 3-4 weeks gap in most other countries. Did the longer gap confer greater protection? And although other countries caught the UK up in terms of the percentage of adults double-jabbed, some of those with current increases, such as Germany, do have lower vaccine coverage than the UK.
A third and related reason could be the impact of the booster jabs. These started earlier in the UK than elsewhere and have followed the rapid rollout of the first and second jabs, with the booster being offered six months after the second jab. The table below shows the percentage of the population that has been given a booster jab – this is based upon all persons, not just adults or those in vulnerable groups, but it does show how the booster programme varies by country.
| Country | % Booster Jabs |
|---|---|
| Netherlands | 0% |
| Slovakia | 0% |
| Poland | 6% |
| Czechia | 6% |
| Germany | 8% |
| Spain | 8% |
| Cyprus | 9% |
| Belgium | 10% |
| Austria | 15% |
| Malta | 20% |
| United Kingdom | 23% |
| Iceland | 32% |
What is interesting about this table is that the countries with rapid recent growth in positive tests are those with the lowest percentage having third jabs. Austria actually does quite well on booster jabs but the five countries with the lowest level of booster jabs all have rapid increases in the number of positive tests in the past two months. Spain and Cyprus have low roll out of booster jabs but up to now have not seen any evidence of a fourth wave; perhaps their geographic distance from the countries shown on the map is helping to keep a fourth wave at bay for now.
In summary, it does seem that the following factors are important in how quickly any fourth wave is developing:
- When restrictions were lifted – those late in the day are generally seeing faster growth in positive cases
- Geographic proximity – those countries at the heart of Europe with adjacent borders are generally seeing faster growth in positive cases
- The roll out of the booster campaign – those countries who are slow in this regard are generally seeing faster growth in positive cases
This article is one of a series, the previous article on dodgy numbers is here.
