27 January 2022
Lies, Damned Lies and Coronavirus
Peak or pique?
by David Chilvers

Today marks the end of most mandatory COVID-19 restrictions in England. It is no longer legally necessary to:
- Wear a facemask on public transport or in indoor spaces (although it is still recommended in tightly packed indoor environments and some organisations, e.g TfL, are still requesting customers to do so)
- Work from home
- Require customers to have a vaccine passport to gain entry to an establishment
- Take a COVID test for fully vaccinated travellers arriving in England
Different rules apply for the time being in the devolved nations, although it is quite likely that these will come into line in due course. In announcing these changes Boris Johnson also indicated that the need to self-isolate following a positive COVID-19 test may be jettisoned when the existing rules reach the end of their current tenure in late March.
The lifting of these restrictions will please the Tory back benches and help prop up the Prime Ministers declining support, but are the changes being made for political reasons or does the data and the science support them? In short, have we passed the peak of the Omicron wave or are the changes a fit of pique to salvage Boris Johnson’s reputation?
Boris Johnson’s plans to scrap Covid self-isolation rules in England from March have been branded “premature” by a World Health Organization (WHO) official. Dr Maria Van Kerkhove, the Covid-19 technical lead at WHO, said she was alarmed by the Prime Minister’s plans to end mandatory self-isolation for positive Covid cases. She also indicated that England was scrapping mandatory face mask rules and the work from home mandate too soon.
Minutes from the 7 January meeting of the government’s Scientific Advisory Group for Emergencies (SAGE) warned that lifting the restrictions before the peak was passed in all regions could result in more hospital admissions.
And modelling produced for SAGE by the University of Warwick suggests that if precautionary behaviour declines gradually in the four months after lifting Plan B there could be a spring wave leading to between 1,000 and 2,000 daily hospitalisations. But we know how good Warwick modelling has been up to now, so is this another dire prediction like the one made at the end of December?
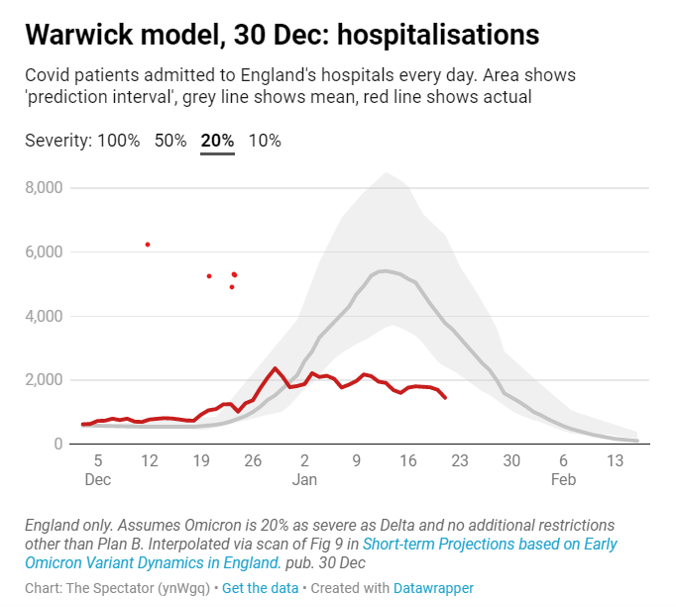
Even on the assumption that Omicron is only one fifth as severe as Delta, the Warwick forecast was higher than the actuals by a large margin. So, should we give much credence to their latest prediction on hospitalisations?
Whilst the SAGE scientists remain pessimistic, some scientists and politicians have been more optimistic. Sir Jeremy Farrar, director of the Wellcome Trust and former SAGE adviser said “The UK in particular and some other countries are in a very, very strong position now. They have fantastic rollout of vaccines and there’s a high degree of natural immunity, and it was reasonable for the government to start looking at lifting restrictions”.
In terms of hard statistics, a total of 3.4 million Britons were estimated to be infected with Covid in the seven days to 15 January, according to the Office for National Statistics (ONS) – down from 4.3 million in the previous week. It is the first week that the ONS’ weekly Covid report, seen as the gold standard for predicting the scale of the UK epidemic, has recorded a drop in cases since Omicron first took hold in late November. However, it is worth remembering that the ONS data is typically about two weeks behind real time, with data being collected over a one-week period and then taking another week to analyse and report. So, a reduction in cases from this source a couple of weeks ago is consistent with the published daily total of cases (positive tests).
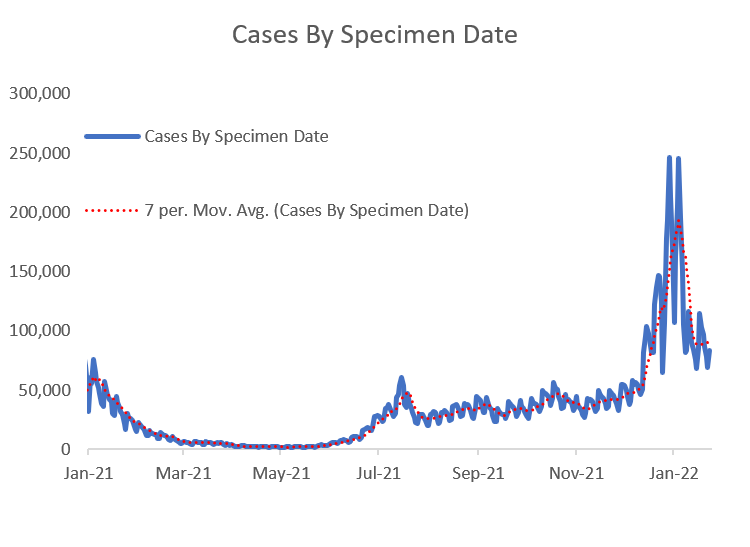
This data shows the number of cases by the date when the specimen was taken and is less vulnerable to variations in reporting; however, data for the last few days may be revised, typically upwards. And as we reported in our last article a change in the reporting regime may lead to understatement of the number of positive tests. In the past, if you tested positive after a Lateral Flow Test it was mandatory to have a PCR test, the results of which are all reported in the daily data. Now, if you are fully vaccinated and generate a positive Lateral Flow Test result, you must self-isolate for five days and should report the results yourself to the Government website, but there is no check on this and it may be that a number of those testing positive do self-isolate but do not report their result.
Be that as it may, if you look in more detail at the last few weeks, you see a slightly different picture.
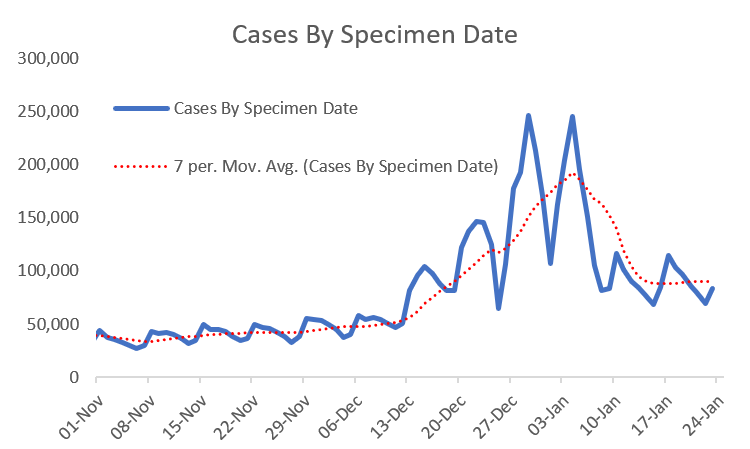
The number of positive tests dropped over Christmas Day and Boxing Day and around New Year’s Day, as less people took tests on those days. But on this shorter time scale, the number of positive tests has fallen but then plateaued at just under 100k per day with the seven-day moving average actually increasing a little in the past week (even without any potential under-recording as highlighted above). So, this shorter time horizon suggests that the sharp fall in cases may be stalling and the question is whether this is temporary (I.e., further falls soon) or permanent.
Many of the recent cases have been among younger children, following the return to school at the start of January. Comparison of the share of new “cases” taken by the younger age groups is quite stark:
date 01/01/22 21/01/22 ratio
0-4 1.89% 4.79% 2.54
5-9 3.36% 16.01% 4.76
10-14 4.16% 12.54% 3.02
On 1st January, just over 3% of the positive tests recorded in England were among children aged 5-9; just three weeks later this percentage had increased five-fold to 16%. For those aged 0-4 and 10-14, the percentage of positive tests had more than doubled. Young children in general do not suffer severely from Omicron so it may well be that these rises do not translate into many hospitalisations. Among those aged 50-84, there has been a drop in the percentage of positive cases taken by this age group. Only among the very elderly has there been a (small) increase in the percentage of positive tests recorded among those aged 85+:
date 01/01/22 21/01/22 ratio
50-84 24.85% 17.26% 0.69
85+ 0.91% 1.28% 1.41
In South Africa, the fall in the number of positive tests was steep and continued to the extent that the number of cases is now as low as it was at the start of the Omicron wave.
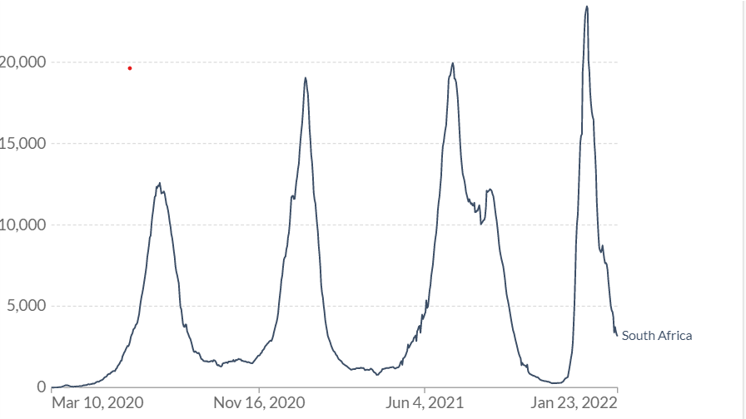
Will we follow this pattern or is our recent plateau a sign that Omicron is not finished yet? Boris has gambled on the former but it’s a bit early to be sure and this leads to the conclusion that the ending of restrictions today is a political decision not one guided by the data (as the data is not yet conclusive about the end of the Omicron wave).
Some may argue that case numbers are irrelevant and as long as serious disease is under control, that is all that matters, and the increasing prevalence of positive tests among younger children supports this view. So, here is the current data on UK hospital admissions and number of patients in hospital.
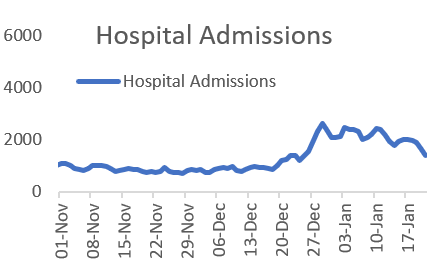
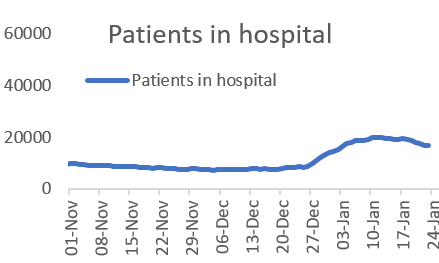
Both these charts point to continuing high numbers – nothing like the Spring Wave last year thanks to the vaccine rollout and the immunity generated through a very large number of infections. But also plateauing, not yet declining.
Over the next few weeks, we shall see if this gamble by Boris saves his job and also whether it leads to a rebound in Omicron – but it is clearly a decision based upon politics and not on medical or scientific data.
This article is one of a series, the previous article on the NHS absences is here.

