
26 November 2020
Lies, Damned Lies and Coronavirus
Do lockdowns work?
by David Chilvers
 Lockdowns have been used by most governments around the world to try to suppress the spread of coronavirus. The main exception has been Sweden but even here restrictions have been introduced recently. We know that lockdowns have severe negative effects on economic activity and employment and other health issues. These negative impacts might be worthwhile if there are positive effects of lockdowns on reducing infections, hospitalisation and mortality. So, what is the evidence for this?
In England, we had a fairly complete lockdown from late March until May and are now coming to the end of the second national lockdown which commenced on 5th November. Prior to this, we had a tiered system in place, with Tier 3 areas having the most severe restrictions. If these interventions worked, we would expect to see the number of positive tests reducing from one week or so following the interventions, assuming the level of testing remained fairly constant (alternatively we might expect to see the % of positive tests reducing after a week or so). So, has this happened?
We would normally test a hypothesis like this by comparing the outcome with that from a counterfactual – what would have happened if there had been no interventions. But we can’t really do this here, so we will have to look at what has happened in a number of areas over time and try and draw conclusions from that.
Looking first at the introduction of Tier 3, the table below shows when this level was introduced in each area, followed by the date on which the 7-day weighted average number of positive tests reached its peak.
| Area | Start date | Peak | Days after start | Range |
| Liverpool* | 17-Oct-20 | 08-Oct-20 | -9 | 6th to 20th Oct |
| Lancashire* | 17-Oct-20 | 19-Oct-20 | 2 | 8th to 22nd Oct |
| Manchester** | 23-Oct-20 | 01-Oct-20 | -22 | 1st Oct to 2nd Nov |
| Barnsley | 24-Oct-20 | 22-Oct-20 | -2 | |
| Doncaster | 24-Oct-20 | 24-Oct-20 | 0 | |
| Rotherham | 24-Oct-20 | 28-Oct-20 | 4 | |
| Sheffield | 24-Oct-20 | 05-Oct-20 | -19 | |
| Warrington | 27-Oct-20 | 27-Oct-20 | 0 | |
| Nottinghamshire* | 30-Oct-20 | 31-Oct-20 | 1 | 19th Oct to 5th Nov |
| Nottingham | 30-Oct-20 | 09-Oct-20 | -21 |
Note:
* are areas with a number of constituent local authorities. The range shows the range of dates for the individual authorities when the peak number of positive tests occurred
** for Manchester, the figure shown is for Manchester itself. The range shows the range of dates for individual authorities within the Greater Manchester area
The fourth column shows the number of days after the start of Tier 3 restrictions that the peak number of positive tests occurred:
- For five of the areas, the peak occurred before Tier 3 started
- For two of the areas, the peak occurred on the same day
- For three of the areas, the peak occurred within 4 days of the 3 start
In none of these situations can it be claimed that the Tier 3 lockdown generated a reduction in the number of positive tests as this was either already happening or happened so soon after the start of Tier 3 that the new restrictions could not have been the influencing factor in the reduction.
This analysis suggests that there is no evidence that the Tier 3 restrictions were responsible for the reduction in the number of positive tests which had occurred; the reduction was already happening presumably due to some other factor.
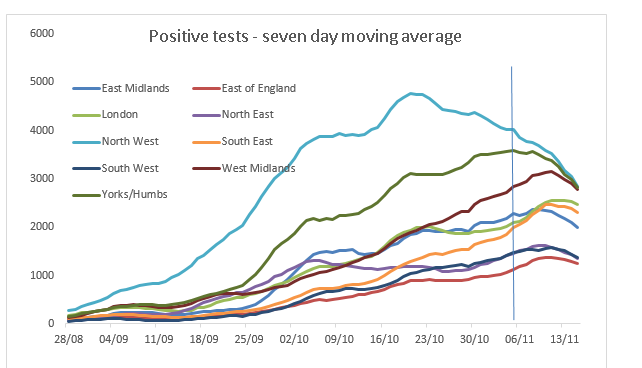
Looking at the national lockdown which started on 5th November, daily data on the number of positive cases has been taken from the ONS website. Data has only been used up until 15th November, as more recent data tends to be revised upwards. Seven day moving averages have been created to smooth out any major day to day variations.
The chart shows the lines for each English region and the vertical line represents the start of lockdown. Again, we can see here how positive cases in the North West were on a major downward trend since mid-October, confirming the data shown earlier for individual areas. For Yorkshire and Humberside, the East Midlands and the West Midlands there is some evidence of falls in the last week or so but two of these areas have Tier 3 authorities where we have already seen reductions prior to or close to the introduction of Tier 3. So, for the other parts of these regions, the number of positive cases must have continued to rise since the start of the national lockdown on 5th November. The same pattern seems to be the case for London, the South East, South West and East of England.
The data for English regions thus seems to show that the decline in Tier 3 areas evident before they were introduced has continued through the national lockdown; and that there has been minimal impact in other English regions.
What about the devolved nations, where different lockdown rules were in force?
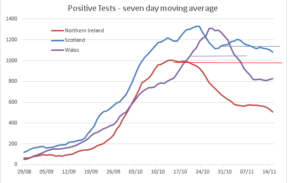
The horizontal lines on this chart show when the various restrictions were in place:
- In Wales, a fire breaker lockdown was in place from 23rd October to 9th During this period, the number of positive tests rose in the first week and then started to fall; there is thus some evidence that cases only started to fall once the lockdown was in place
- In Northern Ireland, a national lockdown began on 16th October and continues. The number of positive tests started to fall on the day the lockdown commenced, too soon for this to be an effect of the lockdown
- In Scotland, a five-tier system was introduced on 2nd November and continues. The number of positive tests has oscillated in a narrow band since the start of this system and was actually falling before it started
For the devolved nations, there is thus some evidence that the fire breaker in Wales was accompanied by a subsequent fall in the number of positive tests, but no strong evidence of any correlation in Scotland and Northern Ireland.
All the analysis of Tier 3 areas, English regions and the three devolved nations shows very little evidence that restrictions have been accompanied by a subsequent fall in the number of positive tests. In some areas, numbers were falling before the restrictions either came into play or had a chance to work and in other areas the number of positive cases continues to rise after the introduction of restrictions. The case for lockdowns influencing the spread of COVID-19 is very limited.
So, what is it that is causing the number of positive tests to either increase or fall irrespective of lockdown or tiering interventions? As we have suggested before, it may be the case that with a smaller potential host population than in the first wave, infections in this current wave are reaching a peak level and then recede based upon the declining opportunity to infect individuals. In some areas and regions this peak has been reached and the number of positive tests is declining, whilst in others there is still some way to go before the peak is reached. Vulnerable individuals are now much clearer about risk and the application of social distancing, hand hygiene and generally keeping space from others is well entrenched in many people.
As Ivor Cummins and others have suggested, is this just a seasonal phase of a respiratory disease that is following a pattern similar to other such diseases (although more infectious and with a higher death rate)? Think back to the summer when beaches were crowded, restaurants and pubs were trading and the retail sector was largely open. Did infections go up sharply with all that human interaction? The answer to that is “No” so what is the difference between then and now, apart from seasonality?
Despite there being little evidence that the three Tier programme and the subsequent national lockdown worked, we are now going into a strengthened version of the three Tier programme. To return to the question posed at the start of this article, lockdown doesn’t work; so, let’s do more lockdown! The number of positive tests will continue to decline in some areas and soon peak and then decline in others and the politicians and scientists will claim that this is a result of the tight lockdowns. But scientists, by the nature of their discipline, have a duty to look at data and come up with conclusions that are consistent with the patterns the data is showing. As the people affected by their advice, we have a right to ask that they follow the best scientific practice. But there is little evidence they are doing this (witness the 49k Vallance prediction, the dodgy 4k death forecasts) and they will probably not answer the question as to why positive tests were declining in many areas before any of the Tier 3 restrictions were put in place. The deductions made from the data continue to be poor and will increase the severity and effects of the recession caused by the lockdowns.
*This article is one of a series, find last week’s article “Covid Positivity” here.
