
4 March 2021
Lies, Damned Lies and Coronavirus
Variants and variance
by David Chilvers
 This week, we look at the progress of the Kent variant identified in the UK in December. We first looked at this at the start of 2021 and concluded that this variant had been increasing rapidly in London, The South East and the East of England in December last year and was sufficiently concerning to cancel Christmas. Since then, there have been other variants detected in South Africa and Brazil but, as yet, these do not appear to show high incidence in the UK. Each time there has been an occurrence of these two variants, there has been a determined attempt to narrow down locations and put surge testing into place, to try and inhibit spread of them. So far, this seems to have been successful and the South Africa and Brazilian variants do not appeared to have developed at any scale.
The Kent variant has become the dominant UK variant, with its higher levels of transmissibility and potentially higher severity and you will recall that the detection of this variant let to the virtual cancellation of Christmas 2020.
This is an extract from the Minutes of the Sage 74 meeting on 22nd December last year: “NERVTAG and PHE have assessed the currently available evidence on the new variant and have published their assessments and evidence. There is high confidence that this variant is spreading faster than other SARS-CoV-2 virus variants currently circulating in the UK, based on several different analyses. The cause (or causes) of that faster spread are unclear, but evidence is consistent with an increase in transmissibility being a factor.” Another paper produced the same day concluded that “NERVTAG’s early review of four analytical approaches suggests that this new variant could be associated with an R number that is 0.39 (95% CI: 0.24:0.55) higher than other lineages, a growth rate that could be 71% (95% CI:67%-75%) faster per generation than other variants”. The conclusion was that the new variant was already dominant in some parts of the UK and would be likely to do so in other regions in due course.
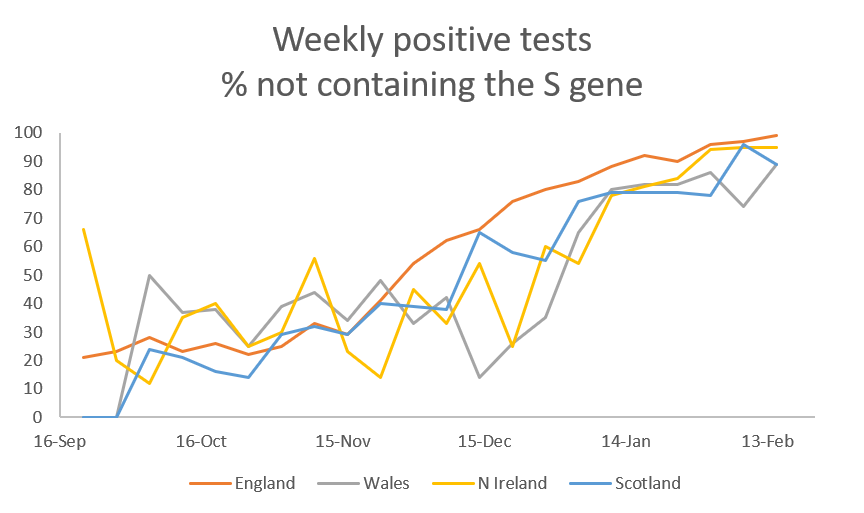
The Office of National Statistics now includes estimates of the variant of the virus which is detected, as part of its weekly COVID Infection Survey. This shows two sets of data:
- The percentage of each positive tests that includes each of three specific genes – the N, ORF1ab and S genes. We have looked at the % of total positive cases each week that do not include the S gene, as these are indicative of the presence of the new variant
- Modelled daily estimates of the new variant itself. Each positive test is classified into being the new variant, the original variant and unable to be allocated. We have calculated the percentage that the new variant takes of the new and original variants combined, omitting those where the variant cannot be determined as the virus load is too low
The trend of the weekly data is shown below.
This data shows the percentage of positive tests that do not contain the S gene increasing in each of the four nations and then levelling off between 89% and 99%. In terms of the specific variant, the daily estimates from modelling show the pattern below:
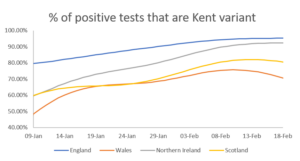
This data smooths the perturbations present in the weekly data and again shows the percentage of positive tests that relate to the Kent variant increasing and then levelling off at slightly lower levels between 69% and 95%. For Wales, there appears to be a decrease in the last week or so, but the sample size here will be quite small.
These trends do indeed show the Kent variant, with its higher transmissibility, becoming dominant everywhere in the UK but not completely squeezing out the original strain of COVID-19. Given the higher transmissibility of the Kent variant, this seems a little odd to me; I would have expected the Kent variant to continue to increase its share of overall positive cases towards 100%.
At the same time, the overall incidence of COVID-19, as measured by the number of positive tests, has shown a steady decline since early January. This week, ONS estimated that the R value was below 1 in every region and nationally was in the range of 0.6 to 0.9. Given that SAGE had commented that the Kent variant was more transmissible and added 0.39% to R, does this mean that the old variant of coronavirus in the UK now has an R of around 0.4?
Irrespective of this, the data shows that the dominant virus for the past two months in the UK has been the Kent variant; and in spite of its increased transmissibility, the reductions in social contact have brought the number of infections down very quickly. In addition, the use of localised surge testing appears to have ensured, for now, that the South African and Brazilian variants have not spread beyond a handful of cases. All the evidence is that the testing regime works best when there are relatively small numbers of cases, which is the situation which we now find ourselves in.
This article is one of a series, find the last one here.
