29 October 2020
Lies, Damned Lies and Coronavirus
The age factor
by David Chilvers
This week we look at the differential effect that COVID-19 has among different age groups*. There is a lot of media comment that COVID-19 is a disease which disproportionately affects the elderly. And whilst the current wave has generated a lot more positive cases among younger people, it is still the case that hospital admission rates are much higher among elderly individuals.
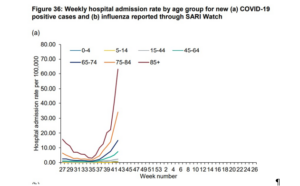
The Weekly National Influenza and COVID-19 Report, produced by PHE, contains a lot of useful data including the following chart from the most recent week (week 42 is the week ending 18th October):

This chart clearly shows that hospital admission rates with COVID-19 increase steadily with age. You might think from looking at this chart that virtually all the hospital admissions are among those aged 85+, as the rate in this age group is so much higher than for younger people. But you would be wrong, and the reason is that there are relatively few individuals aged 85+ compared to those in the other age groups. If you apply the hospital admission rates for week 42 (week ending 18th October) to the numbers of individuals in each age group, the following results:
| age band | population | admissions/million | number | % of admissions |
| 0-4 | 3,496,750 | 1 | 3 | 1% |
| 5-14 | 6,394,388 | 0.5 | 3 | 1% |
| 15-44 | 22,698,404 | 3 | 68 | 15% |
| 45-64 | 14,263,297 | 8 | 114 | 26% |
| 65-74 | 4,852,833 | 15 | 73 | 16% |
| 75-84 | 3,115,552 | 34 | 106 | 24% |
| 85+ | 1,254,688 | 63 | 79 | 18% |
This shows that 18% of those admitted to hospital with COVID-19 in week 42 were aged 85+ and 42% were aged 75+. If you go back a few weeks, the relevant percentages are 19% and 44%; if you go back to the peak of the first wave the relevant percentages were 20% and 45%. So, this is the normal pattern for the age distribution of people entering hospital with COVID-19.
This made me wonder what the age profile is for other hospital admissions, as a relevant comparator. This is what economists call a counter factual – measuring what would have happened in the absence of the intervention, and impact is estimated by comparing counterfactual outcomes to those observed under the intervention. There is no point commenting on a high figure if in normal circumstances the figure is equally high.
For hospital admissions with COVID-19, the comparator or counterfactual might be emergency admissions for other diseases such as suspected heart failure, strokes, cancer etc and indeed any other emergency that was not related to an accident of some sort. I’m sure this data must be available somewhere within PHE but I could not find it anywhere in publicly accessible websites.
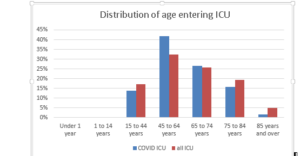
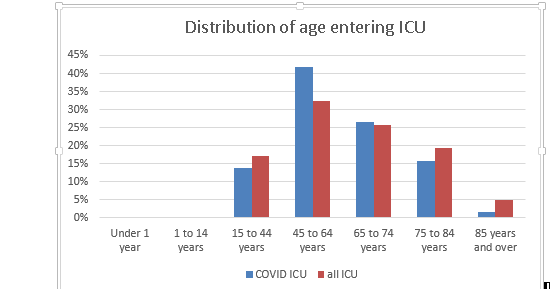
There is data to compare the age distribution of those admitted to ICU units with COVID-19 and those admitted generally. The COVID-19 data comes from the PHE weekly report and the all ICU admissions data from a publication describing NHS-funded inpatient, day case and adult critical care activity in England in 2018-19, with the data source cited as Hospital Episode Statistics (HES).

So, whilst 20% of those admitted to hospital with COVID-19 are aged 85+, only 1.5% of those admitted to ICU with COVID-19 are aged 85+ – the corresponding figures for those aged 75+ are 45% of hospital admissions but just 17% of ICU admissions. And both age groups see a smaller proportion of COVID-19 ICU admissions than all ICU admissions in 2018-9. There was an Insight report in the Sunday Times last weekend identifying that older COVID-19 patients were less likely to be admitted to ICU than might normally be the case and this analysis seems to confirm that conclusion.
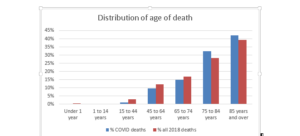
Another set of comparable data is available relating to mortality. ONS produces data derived from death certificates on the age of death and the latest annual data is for 2018 – well before any COVID impact. ONS also produces data on the number of COVID-19 deaths by age group, again from death certificates – so the data sources are comparable. I found the results quite interesting:

The percentage of those aged 75 and over that die with COVID-19 mentioned on the death certificate is slightly higher than the normal but not hugely so. This ties in with the often stated comparison that the median age of death from COVID-19 at 82.4 is slightly higher than the median age of death generally is 81.5.
We see lots of media headlines that COVID-19 is a disease that affects the elderly but no headlines that many other diseases and life generally affect the elderly – the counterfactual. This was in The Guardian on 13th May 2020:
“Pensioners 34 times more likely to die of Covid-19 than working age Brits, data shows”
The comparative figure for all deaths is that pensioners are 23 times more likely to die than working age Brits (this is comparing death rates per million as the 34 figure does). If we had data for heart failure, cancer, dementia I am sure we would find a similar if not more accentuated pattern. The basic fact is that a much higher proportion of pensioners are more likely to die than working age Brits because they are older – as John Cleese might say a statement of the bleeding obvious.
When analysing this sort of data, we see the importance of a relevant comparator or counterfactual, which does appear to be missing in much of the media comment about COVID-19. Although many of the patients admitted to hospital with COVID-19 are aged 75+, we don’t know whether this is usual for other diseases requiring emergency hospital admissions. The age skew does not filter through to admission to ICU, where most COVID-19 patients are aged 45-74. But the distribution of the age of death from COVID-19 is similar to that for deaths overall – sadly, older people are more likely to die, from COVID-19 and many other conditions – so the counterfactual is important here to draw conclusions.
* Find last Week’s article “A Breaking Wave” here.


