

12 November 2020
Lies, Damned Lies and Coronavirus
Understanding models.
By David Chilvers
 This week*, we continue our theme of looking at how data on COVID-19 has been and is being analysed. Since the onset of the pandemic, policy decisions have been driven by outputs from the models that SAGE uses to forecast the number of infections and deaths. So, what is behind these models and what questions might we ask about them?
I’ve not developed many models in the medical sector, but I have developed hundreds of models in other sectors. Models are created by analysing data and attempting to determine underlying relationships between different factors. The models can then be used to predict what might happen in a range of situations, often called scenarios. The utility of the models crucially depends upon the quality of the data available and the extent to which the assumed relationships reflect what is happening in the real world.
When looking at the spread of a biological phenomenon, like the virus behind the COVID-19 pandemic, models typically look at the initial rapid spread of the virus, the extent to which this levels out and eventually declines. In a previous article we showed a graphical example of a fairly typical pattern which tracked the development of positive cases during the first wave in the UK. Similar curves exist for hospital admissions and deaths. This type of curve is called a Gompertz curve and requires assumptions to be made about:
- The eventual level of infection – called the asymptote – the level that the infection reaches cumulatively after a very long period of time
- The displacement rate – the time by which the infection reaches half the ultimate level
- The growth rate – how quickly the infection grows when it starts to accelerate
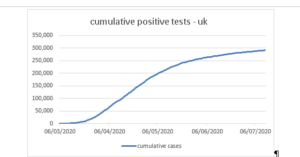
At the start of the pandemic, there is very little data apart from how quickly the disease is spreading. Assumptions need to be made regarding the maximum number of positive cases that might be seen after a long period of time – the asymptote which the above graph approaches on the right hand side.
To do this for COVID-19, assumptions need to be made including:
- How many people have natural immunity to the virus?
- How many people acquire immunity, principally by experiencing the disease?
- How many people can be protected against catching the disease through various interventions?
The impact of the third item can be simulated for various interventions including:
- shielding vulnerable groups (the number can then be removed from the potential total that the virus can reach)
- restricting social contact through a range of measures – closing schools, closing hospitality, rule of six etc.
The impact of each intervention on its own, or in combination with others, can then be modelled and a revised version of the chart above be created. Data on the proportion of cases leading to mortality – the Infection Fatality Ratio (IFR) -can be superimposed on the infection model to predict the number of deaths.
As with any modelling work, as new data becomes available the assumptions used can be tested and, as necessary, modified.
At the start of the pandemic, SAGE assumed that there was no natural immunity and that the IFR was around 1.2%. With around 67 million people in the UK, a 1.2% IFR suggests 800,000 fatalities assuming everyone eventually becomes infected but that people only get the disease once. This was the (very simple) logic behind the original Imperial College estimate that without interventions there could be more than 500,000 deaths from COVID-19 in the UK.
The various interventions reduce the 67 million potential total and estimates would have been made by SAGE as to how the asymptote would reduce from the initial fairly comprehensive lockdown. With around 50,000 deaths and an IFR of 1.2%, the asymptote for infection during the initial lockdown would appear to have been reduced from 67 million to around 4.2 million. This demonstrates how the reduction in social interaction forced by the lockdown and the associated hygiene measures (washing hands, using masks, social distancing and shielding) has worked in substantially suppressing the virus, albeit temporarily.
As time goes by, new data becomes available to help refine the models. In terms of natural immunity, the SAGE models appear to continue to assume this is zero, treating COVID-19 as a new coronavirus to which the body has no natural immunity. There is a body of scientists including Carl Heneghan and Mike Yeadon that questions this assumption on the basis that whilst COVID-19 is a new virus, it has elements in common in with previous coronaviruses (including the common cold) to which we have developed some natural immunity. This group estimate that natural immunity might be as high as 30%.
The current SAGE assumption on the level of acquired immunity appears to be around 7%. This comes from the weekly ONS survey which for some respondents tests the presence of antibodies in the blood. This estimate is broadly consistent with 50,000 deaths and an IFR of 1.2% generating 4.2 million infections out of a population of 67 million (6.3%). However, there is some debate about the IFR, with different groups estimating this in a range from 1.4% down to 0.2%. Using 0.2% means the 50,000 deaths imply 25 million infections or 37% of the UK population. Together with a possible 30% natural immunity, this would leave 33% as the potential asymptote for further infections under these different assumptions. Whilst this might be extreme it is worth looking at what impact this has on estimates of rates of infection and consequently on mortality.
The charts below show how the alternative assumptions reduce the asymptote for the growth curve and also flatten the curve.
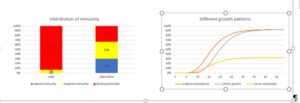
The chart on the left shows the assumptions made about natural and acquired immunity. The chart on the left shows how the disease might develop for three sets of assumptions going forward:
- current SAGE assumptions with 93% asymptote
- the same assumptions but with a longer displacement
- using the 33% assumption for the asymptote but otherwise the same as the original assumptions in the first line
You can see the impact that altering assumptions has on the shape of the infection curve.
These differences are so large that one would have thought they warrant at least discussion and publicity. But until recently, it was only the SAGE models and the forecasts they generated that were achieving any publicity. The lack of credibility of the forecasts shown in the coronavirus press briefing on 31st October has led to a greater degree of questioning the SAGE assumptions, including at a recent Select Committee meeting and in the Parliamentary debate about introducing the second lockdown. Several respected media commentators, including Ed Conway at Sky News, have highlighted some of the inconsistencies in the data used by SAGE.
To help see where the asymptote for the second wave might be, we can look at how the second wave is progressing. The number of positive cases reported remains fairly stable between 19,000 and 27,000 in each of the last 23 days, from 19th October to 10th November. This is definitely not exponential growth, it is hardly growth at all with the cumulative increase over the past seven days being 2.3% – so a daily growth rate of 0.3%. The R is gradually being revised downwards to a range of 1.1-1.3 from 1.3-1.6 a couple of weeks ago. This does suggest in terms of positive cases, we might be at the point of the Gompertz curve where levelling out occurs. If this was the case, the total deaths from the second wave might be in the region of 15,000, substantially less than the 50,000 which occurred in the first wave.
In our article on 8th October, we posited that the second wave might already be stabilising – this is what we said a month ago
“Could this last point be the first evidence of a turning of the tide? It is early days yet but the current data on the second wave does seem to suggest that the impact may be substantially less than the first wave, even though we have released a number of restrictions.”
We see no reason at present to change this view, even though all the SAGE models are still forecasting a rapid rise in positive cases, hospital admissions and deaths. The first of these – positive cases – does seem to have stabilised and although the number of hospital admissions and deaths are still increasing, it will only be in the next couple of weeks that any turning point in positive tests feeds through into these other measures. By then, we will be halfway through this new lockdown with all the collateral damage to other aspects of health and to the economy.
*Find last Week’s article “A Time for Reflection” here.
