11 February 2021
Lies, Damned Lies and Coronavirus
Where do we go from here?
by David Chilvers
 This week, we look at how the current wave of COVID-19 is progressing and how this might develop over the next few months. With the peak of this wave clearly passed, there is pressure from some parts of the Conservative party to unwind restrictions as quickly as possible. However, as we will show, the pressure on the NHS is still very high and will not return to the levels seen last summer for several months and we therefore suspect that restrictions will be eased quite slowly and cautiously this time.
Since the start of the latest lockdown on 5th January, the number of positive tests has fallen steadily. It is worth noting that the peak of the seven-day moving average of positive tests was 61,253 on 1st January, and so the number of positive tests started to fall before the lockdown began; this is a phenomenon that has been observed in previous lockdowns and we will return to this in a future article to try and understand why the number of positive tests always seems to peak before lockdowns start and certainly before their impact can be felt. But this week, we will focus on what is happening as the lockdown tightens and how this might play out.
In the last couple of weeks, the number of hospital admissions has stabilised and then started to fall whilst the number of deaths also now appears to have peaked. R is reportedly down to 0.8 nationally and this wave is clearly on the descent from the peak. Vaccinations of the most vulnerable groups continues at an average of over 400k jabs per day and the first target of giving the four top cohorts in the vaccination hierarchy their first jab by 15th February looks very likely to be achieved. The government is predicting that all over 50’s will be offered their first vaccination by May, although as we predicted in The Vaccine Rollout, we think this will be achieved by early April, as long as vaccine supply remains steady and at least at current levels.
There are already calls for lockdown to be eased, even though the number of COVID patients in hospital remains above the Spring 2020 peak and the average number of deaths per day is still above 1,000. Clearly, numbers need to fall further before any major return to normality can be countenanced. So, when might this be?
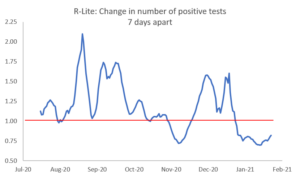
R is used to estimate how many people someone will infect and this can only obviously occur whilst the person is infectious. To enable predictions to be made, we have used a slightly different concept – the % of positive tests that arise seven days later, this being the assumed period when an infected person is most likely to pass on the virus. We will call this R-lite for simplicity but it follows a very similar pattern to the official estimates of R.
Looking back to the end of last summer, the chart below shows how R-Lite has varied over time.
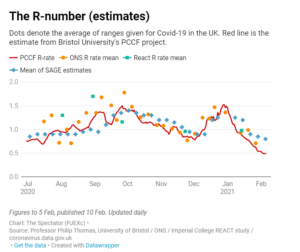
 That compares with the official estimates of R from various sources as they appeared on the Spectator dashboard:

The two charts show a very similar pattern over time (R-Lite looks more variable but the scale is suppressed on the chart on the Spectator’s figures).
Both R and R-Lite were high in early September, as schools and universities returned and the number of positive tests began to increase substantially. With the Rule of Six and the Tiers introduced during the autumn and then the second national lockdown in November, both measures declined. However, when the lockdown was eased at the start of December, R and R-Lite increased rapidly, probably driven by the Kent variant, which was deemed to be more transmissible than the original variant. From the start of January, R-Lite has declined steadily to be around 0.85 at the moment. The drop for a few days at the end of December will be due to significantly reduced levels of testing around Christmas and the New Year.
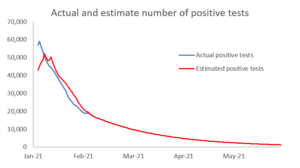
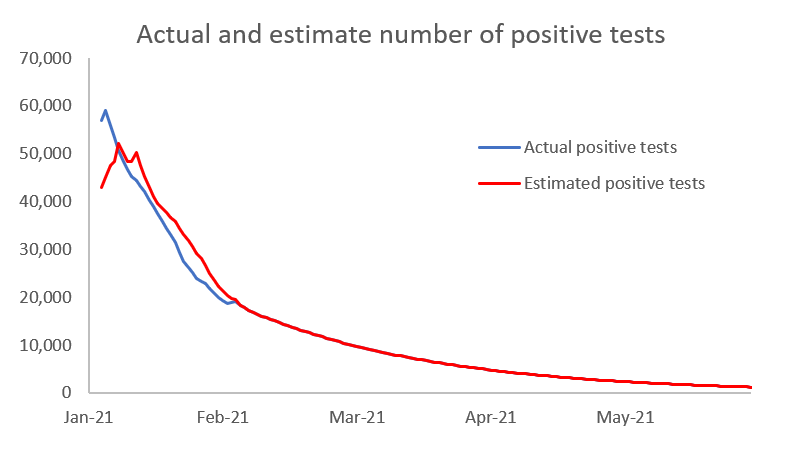
We can use R-Lite to forecast the number of positive tests seven days ahead and repeatedly apply this simple model into the future. The chart below shows these forecasts and also shows how well R-Lite predicted the number of positive tests since the start of 2021.

As can be seen, this simple model correlates well with the actual data for the period up until 4th February. Assuming the value of the seven-day ratio stays at its current value of around 0.85, this simple model suggests the following results for the seven-day moving average:
- Positive tests being under 9,000 per day by the first date by which schools in England might return (8th March)
- Positive tests being under 5,000 per day by Easter
- Positive tests being under 1,000 per day by 10th June
Of course, there are a range of factors which might change the current value of both R and R-Lite:
- The roll out of the vaccination programme to the nine top cohorts, probably by Easter, would offer protection to the 99% of the population groups most at risk of death from COVID-19; this may reduce R and R-Lite if the vaccines protect against infection in addition to protecting against severe illness
- The impact of warmer weather in Spring and Summer should reduce R and R-Lite
- The reduction in infections itself should continue to reduce R and R-Lite
- Any impact of new variants might increase R and R-Lite
- Any loosening of restrictions will increase R and R-Lite
As with the ending of previous lockdowns, a balancing act will need to be struck between the positive impacts that vaccination, better weather and falling caseloads will have against the increase in social interaction that inevitably occurs as restrictions are eased. These will be the calculations that scientists, medics and the Government will make in developing the roadmap out of this latest lockdown, which is due to be announced on 22nd February.
Our model can also be used to estimate the impact of the reduced number of positive tests on hospital admissions and on deaths. We have analysed the relationship between the number of positive tests, hospital admissions and deaths with various lags and it is interesting to see with which lags the strongest relationships emerge.
| lag (days) | positive tests/admissions | admissions/deaths |
| 1 | 0.9720 | 0.9833 |
| 2 | 0.9779 | 0.9871 |
| 3 | 0.9822 | 0.9905 |
| 4 | 0.9846 | 0.9931 |
| 5 | 0.9854 | 0.9951 |
| 6 | 0.9849 | 0.9965 |
| 7 | 0.9835 | 0.9971 |
| 8 | 0.9813 | 0.9972 |
| 9 | 0.9780 | 0.9966 |
| 10 | 0.9744 | 0.9955 |
| 11 | 0.9654 | 0.9939 |
| 12 | 0.9598 | 0.9917 |
This table shows the correlation between lagged positive tests and admissions and then lagged admissions and deaths. The highest correlations occur with hospital admissions lagging positive tests on average by 5 days and deaths lagging hospital admissions by 8 days. These estimates tie in quite well with views on how long it takes for a positive test to become serious enough to warrant hospital admission and how long it takes for admission to hospital to sadly result in death for those affected most severely.
Using these time lags, we estimate that by 8th March – the first day contemplated in England for schools to reopen – there would still be around 750 hospital admissions for COVID-19 and more than 200 deaths. Admissions and deaths are likely to be impacted more by the vaccination programme than positive tests, but even allowing for some over-estimation, these numbers are still quite large. Given this, we would be unlikely to see much other loosening of restrictions when schools reopen with perhaps a few socially distanced outdoor sports resuming and some limited outdoor mixing.
By Easter, the model predicts around 400 hospital admissions per day and 100 deaths. These numbers are still high – it is worth remembering that the lowest numbers during 2020 were 97 hospital admissions and 7 deaths achieved on the 22nd and 29th August respectively, consistent with the assumed eight-day lag between these two metrics. Even with positive impacts from the factors listed above, it is hard to see us reaching these sorts of lows by Easter.
When pubs and restaurants reopened in England on 4th July last year, there were 583 positive tests, 217 hospital admissions and 32 deaths. The first date that reaches these levels with our simple model is 13th May, with an estimated 207 hospital admissions and 32 deaths; the number of positive tests is far higher (1,938 compared to 583, but we are conducting far more tests now than in July 2020 and so would expect to see more positive tests – on 4th July 2020 93,173 Pillar 1 and 2 tests were undertaken, whereas we are currently undertaking 600-700k such tests per day).
It is likely that the lifting of restrictions this wave will be very cautious, with the Government not wishing to see its successful vaccine rollout compromised by any further lockdowns. On this basis, it would seem likely that:
- Few restrictions are likely to be lifted at the same time as schools return, possibly some socially distanced outdoor sports and very limited outdoor mixing
- Some further limited restrictions might be lifted around Easter, including non-essential retail
- The re-opening of gyms, pubs and restaurants might happen by mid May
Despite the clamour for a return to normal, the numbers of positive tests, hospital admissions and sadly deaths are still likely to be too high for anything other than a slow releasing of restrictions.
This article is one of a series, find last week’s article “Visiting Care homes” here.


