
8 October 2020
Lies, Damned Lies and Coronavirus
The second wave
by David Chilvers
 There is now a view that the UK has entered a second wave of the coronavirus pandemic. As we have reported previously*, all metrics related to COVID-19 began to increase in the latter part of August; this was initially related to the number of positive tests, followed by an increase in hospital admissions and sadly deaths.
The upward trends appeared to be quite modest, but there were a few days in early September where the number of positive cases were around double that of the week before (using the 7 day moving averages). This led Chris Whitty and Patrick Vallance to illustrate the impact of continual doubling of the number of infections every seven days culminating in a figure of 50,000 new positive cases per day by mid-October. Although this was presented at a press conference on 21st September as an illustration, it was the only such number shown and it was inevitable that the media would report this as a forecast.
Continuing the doubling process, the entire population would be infected by December and this does not really represent the way a pandemic develops. In the early days, the growth rate is often exponential, as the virus has a large pool of potential hosts to infect. As time goes by and many people become infected the growth rate slows down, as the virus finds it more difficult to locate individuals to infect (assuming there is at least some short-term immunity). It would take a long while for the penultimate person to be infected in the UK to pass it on to the last person. So, the likely curve is one with a rapid acceleration in the number of infections per day until an inflection point is reached following which there is a gradual deceleration in the growth rate. The number of positive tests in the UK followed this pattern during the first wave of coronavirus, as the chart below shows:
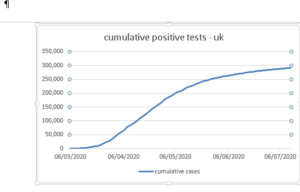
The chart shows the number of positive tests increasing rapidly during late March/early April, levelling off and then starting to decline in late May and flattening out in early July, when the low point on the number of new positive cases was reached.
In the days since the 21st September press conference, the number of positive tests has not doubled every seven days and in fact the trend is more like a linear upward trend. It is hard to be sure following the disclosure of “lost tests” last weekend and the solution of adding large numbers reported to two particular days makes the trend difficult to discern. In any event, comparing the number of positive tests this wave with rhose in the first wave is very difficult due to the vast increase in the number of tests undertaken (250k per day now, 10k per day in late March/early April).
So, as comparing the trend of positive cases with the first wave is difficult, I looked at comparing the number of hospital admissions with COVID-19; however, the first day on which this was recorded was on 19th March in England, when 586 admissions occurred and we have not yet reached this level as yet with the figures hovering around the 400 level for the last week or so. This in itself suggests that the trend in this second wave is below that of the first wave but to shed further light on this I have looked at the data on deaths.
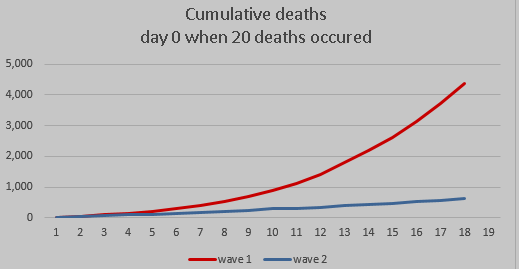
The chart below shows the number of deaths for the first wave and the current wave, commencing each line on the day when deaths first reached 20 (14th March and 14th September):

This chart suggests that the trend for wave 2 is much less pronounced than in the first wave. There was a complete lockdown during the first wave but more relaxations during this second wave with schools, universities, many businesses and some hospitality open, even in areas with local lockdowns. So, we have more social interaction yet less infection and other metrics.
Why would this be? There are a number of possibilities:
- The virus has weakened – as yet, there is no medical evidence for this
- A large proportion of current cases are among younger people, who have better outcomes from catching COVID-19
- The NHS has improved the range of treatments available to patients with COVID-19 using a number of drugs that were not used in the first wave
- Other mitigations have been put in place – the main one here is face masks, which are suspected to have a small positive effect on transmission of the virus
- Better protection of residents in care homes – it is hard to obtain current data on this but there still appears to be an absence of regular testing
- A smaller pool of potential individuals – the first wave was responsible, sadly, for the deaths of many vulnerable individuals with underlying health conditions and/or older people – there are fewer such individuals in the potential pool now
Could this last point be the first evidence of a turning of the tide? It is early days yet but the current data on the second wave does seem to suggest that the impact may be substantially less than the first wave, even though we have released a number of restrictions. We will be monitoring this closely over the next few weeks and providing updates when a clearer picture emerges.
This article is one of a series, find last week’s article “How Many Positive Cases are there?” here.
