
10 December 2020
Lies, Damned Lies and Coronavirus
How different sectors have fared
by David Chilvers
 Lockdowns, including Tiers, seek to reduce human interaction by:
- Limiting the number of contacts an individual makes through rules for people (Rule of Six, households bubbles etc)
- Limiting the number of contacts an individual makes by rules for businesses, which in some cases results in partially or completely closing down particular business sectors where individuals tend to mix
The first of these has limited impact on business whilst the second has major impacts on the type of businesses covered, principally education, health services, personal services, sports, events, hospitality and travel.
All these sectors were closed during the Spring lockdown and gradually re-opened, apart from education. A political decision was made to ensure education opened and remained open after the summer and it is clear now that this sector fuelled some of the rise in positive cases during September. The PHE weekly Flu and COVID surveillance report monitors the number of outbreaks of COVID-19 in different settings (an outbreak is defined as two or more positive cases in the same establishment).
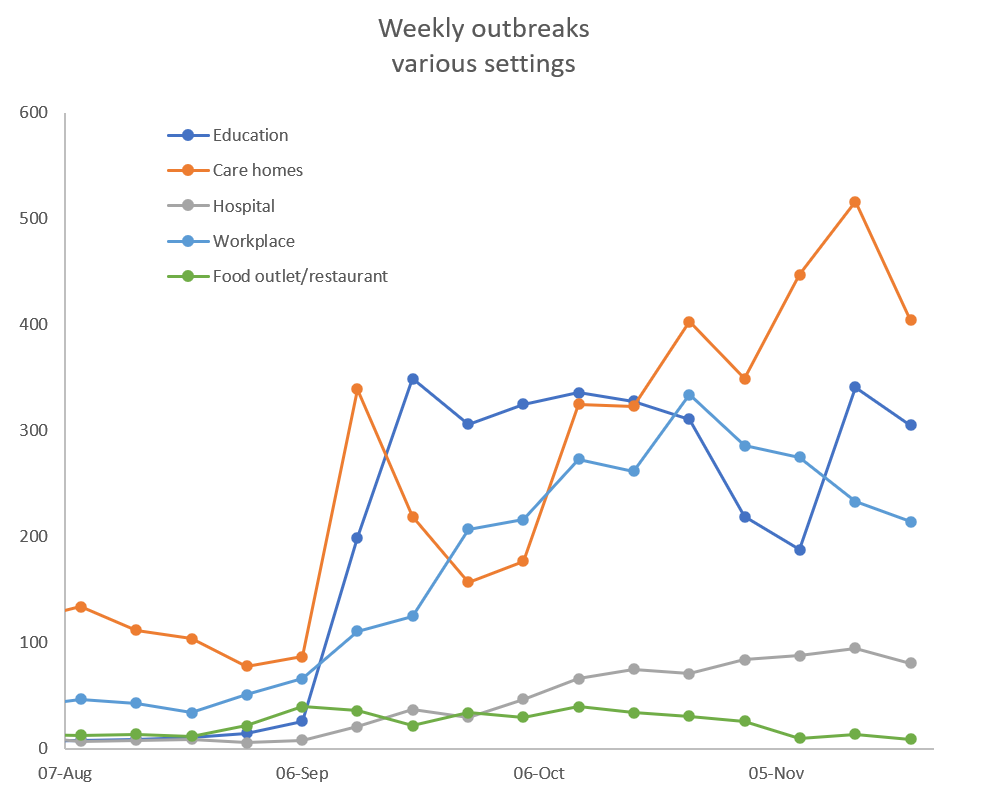
As can be seen from the chart below, taken from the PHE Report, the top three settings for recording outbreaks of COVID-19 are care homes, educational settings and workplaces. At much lower levels are hospitals and food outlets/restaurants.
Up until the first week in September, there were hardly any outbreaks in educational settings. In the middle of September, as schools re-opened and university students started to return to their campuses, the number of outbreaks in educational settings went up steadily to peak at around 350 per week in late September. These institutions had been closed since March and needed to develop mitigation measures to control the spread of COVID-19 in their establishments quickly. In schools, class groups and year groups were typically sent home if a positive test occurred; in universities, students were in many cases effectively locked down in their halls or flats.
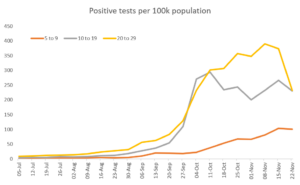
By and large these restrictions worked in the sense of flattening the number of outbreaks, with falls occurring during half term at the end of October and a small rise after it. The PHE weekly Flu and COVID-19 surveillance report confirms both the rise in positive tests among children and young adults and the subsequent fall for 10-19 year olds and 20-29 year olds. Positive tests per 100k among school age children actually steadily increased from early September and have only recently started to decline; for 20-29 year olds, which will include many university students, the rapid rise in the late September/early October, coinciding with return dates, stabilised fairly quickly.
As with education, people who could not work from home were encouraged to return to work in September, with a rising trend in workplace outbreaks during September/October, but showing falls from late October onwards as the advice reverted to work from home if you can once the second national lockdown took place.
Outbreaks in care homes also increased, although not to the extent that was seen in the initial wave in the Spring. In both Tier 3 and the national lockdown, restrictions were not changed significantly in these settings, so again it is unlikely that either Tiers or the national lockdown were responsible for any trends.
One sector, however, stands out. People were encouraged to Eat Out to Help Out during August and this appears to have resulted in some increase in outbreaks in early September. But the numbers – 40 outbreaks per week – are relatively small when compared to the other settings shown earlier (over 300 peak per week in each of education settings, care homes and work places). And there was no increase in the number of outbreaks after early September. As the Tiering system was rolled out in mid-October, the hospitality sector was partially or completely shut down and the number of outbreaks declined to close to zero by November.
We thus have a situation where three sectors that were unaffected by any of the Tiering rules or the national lockdown – education, care homes, work places – showed rises in the number of outbreaks that were gradually contained. The one sector that was hit by restrictions showed no large rise in the number of outbreaks prior to the restrictions and absolute levels that are far lower than those in education, care homes or workplaces.
It could be argued that schools and universities and workplaces accommodate large numbers of people compared to food outlets and restaurants and so it might be expected that outbreaks would be more likely in places where larger numbers of people congregate. So, we have tried to standardise the number of outbreaks by the number of establishments and the numbers who use them:
| Establishment type | outbreaks since 1st August | establishments | people using establishment | outbreaks/ establishment | outbreaks/ 100k people |
| Education | 3,276 | 24,411 | 10,651,165 | 13% | 30.76 |
| Care homes | 4,174 | 15,517 | 457,361 | 27% | 912.63 |
| Work places | 2,777 | 1,983,250 | 32,510,000 | 0% | 8.54 |
| Food outlets/ restaurants | 387 | 88,830 | 4,441,500 | 0% | 8.71 |
| Hospitals | 733 | 1,257 | 8,134,440 | 58% | 9.01 |
Data on the number of outbreaks since 1st August comes from the weekly PHE report. Data for education comes from the numbers of schools and universities and the students within them. Data on workplaces comes from the Department of Employment statistics on rateable premises and numbers employed. Data on the number of restaurants comes from online sources and we have assumed 50 customers per restaurant (if we assumed a higher figure, the incidences shown would be even lower). Data on hospitals comes from Department of Health sources. A number of assumptions have been made e.g., to convert hospital beds to patients, an assumption of 2 days per hospital stay has been made to cover day surgery and longer-term procedures
We have calculated the outbreaks per establishment and outbreaks per 100k using the establishments. Whilst this is a bit rough and ready, there are some clear differences between sectors:
- Workplaces and food outlets/restaurants have a very low % of outbreaks and low outbreaks per 100k people
- Schools and universities have moderate outbreaks per establishment and the second highest outbreaks per 100k students
- Hospitals and care homes have very high outbreaks per establishment and outbreaks per 100k persons are extremely high for care homes
Politically, we have kept educational establishments open and people have been encouraged to go to work if they cannot work from home. Care homes and hospitals, by their nature, deal with infections of various sorts and it is not surprising that outbreaks have been more likely to occur in these settings.
Nothing from this analysis contradicts the view that the number of outbreaks in food outlets and restaurants is low, both in absolute terms and when compared to the number of establishments and customers. So, the risk from this sector appears to be low. Nevertheless, Tiering and Lockdowns have consistently closed down part or all of this sector.
This article is one of a series, find last week’s article “The Liverpool Myth” here.
