
10 September 2020
Lies, Damned Lies and Coronavirus
Local Area Statistics
by David Chilvers
This week*, we look at the local area statistics for COVID-19, which are becoming increasingly important as strategies focus more on local responses to any uplifts in local infection rates.
Each day, ONS produces updated data on its website covering the latest numbers of:
- Tests – numbers undertaken by pillar and capacity
- Cases – numbers of new cases
- Healthcare – number of hospital admissions, in hospital, on ventilators
- Deaths – number of those that have died within 28 days of a positive test
These metrics are typically available for the UK, by nation and by region. The data on number of cases is also available by upper and lower level local authority areas. Data for all metrics at all levels is graphed and can be downloaded into Excel spreadsheets. The number of weekly cases is also available for each MSOA (Middle level Super Output Area) in England, updated daily.
The availability of this data on a single site is a vast improvement on the situation earlier in the pandemic, where data was on lots of different sites and required intimate knowledge of the ONS and PHE site structure to locate what was required.
However, this centralisation of data has not been accompanied by a similar improvement in the quality or utility of the data, particularly at local area level. Concentrating on testing, regular readers will be aware that tests cover four pillars, only two of which really relate to tests for the current infection rates:
- Pillar 1: swab testing in Public Health England (PHE) labs and NHS hospitals
- Pillar 2: swab testing for the wider population – these tests are usually undertaken in drive in centres, mobile test centres or at home
The daily data in the downloadable files appears to reflect the published total at a UK level. But for nations, regions and local authority areas, the downloadable data does not match that shown in the headline figures. We suspect this is due to Pillar 2 data being aggregated quickly to provide a prompt UK figure and then subsequently analysed for lower level geographies so that the local data is only really accurate a few days later. Data for devolved nations may also only feed in subsequently. This is the data from the daily updates:
| Data for 04/08 | UK | England | East | Chelmsford |
| On 04/08/2020 | 670 | 0 | 0 | 0 |
| On 05/08/2020 | 670 | 37 | 3 | 0 |
| On 06/08/2020 | 670 | 538 | 15 | 0 |
| On 26/08/2020* | 1,015 | 888 | 55 | 0 |
On 20th August, a change was made to the way daily data was published and this explains the change in the UK total (which as mentioned does not normally change). For England and the East of England, the numbers gradually increase over time. In essence, this means that at anything other than UK level , the data is of no real value and should not be published until all returns are available; otherwise the daily graph shows the number of cases reducing at anything other than UK level, but this is due to missing data rather than real reductions. It is hard to see how professional statisticians could countenance the publication of data knowing that it will be fundamentally altered over the next few days and possibly lead to erroneous conclusions.
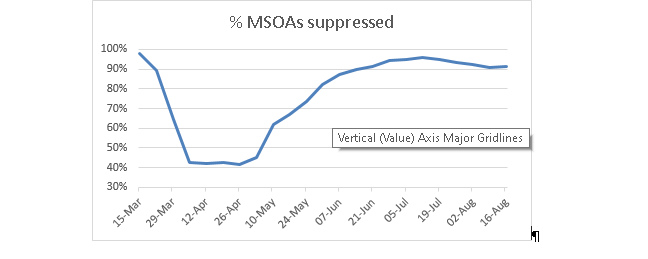
The second issue arises with the weekly data at MSOA level. This is shown as a map and a downloadable file. The map shows data for the latest week, the file shows data for every week in 2020. The big issue with this data is that any MSOA with 2 or less cases has its data suppressed and so it is not possible to determine whether an area has 0, 1, or 2 cases (in the last week on the map and every week on the file). The proportion of MSOA’s where data is suppressed is currently over 90%, as the chart below shows:

When the pandemic was at its peak during April, only around 40% of MSOA’s had their data suppressed. But since mid-June, over 90% of MSOA’s have had data suppressed. This hinders local interpretation and indeed conclusions drawn; there is a world of difference between an MSOA that has had no cases for two months compared to one that has had 1 or 2 cases every week for the past two months. In the first situation, the virus has been (temporarily) taken out of a local area, in the second case it is bubbling along at a low level.
Suppression of data is often used to ensure the anonymity of individuals in small areas. If this data was at a postcode level, for example, of typically less than 20 households, suppression would be important. But MSOA’s typically contain 7-8,000 individuals, so there is no possibility that knowing there are 2 cases in such an area could identify those concerned. Indeed, when cases are above 2, the exact number of cases is published.
That erroneous conclusions can be drawn is highlighted by an article in the Daily Mail on 29th August: Professor John Clancy, from Birmingham City University, has warned that fears of another shutdown are based on ‘dodgy data.’ Writing in a blog, he said: ”91 per cent of England (that’s 51million people) live in neighbourhoods where there hasn’t been a recorded Covid-19 case in the last 4 weeks.’ Not so (unless all the 0, 1 or 2 cases are actually zero every week) – 91% of England lives in areas that have seen 0, 1 or 2 cases each week in the past four weeks.
So, the statistics being produced by ONS suppress useful information and have led to even academics drawing incorrect conclusions. And as mentioned earlier, the daily data at local level should not be published as it is always changed in an upward direction, again leading to the likelihood of incorrect conclusions being made.
This article is one of a series, find last week’s article “Death Rates” here.
