
14 January 2021
Lies, Damned Lies and Coronavirus
Excess deaths
by David Chilvers
One intriguing aspect of the second wave of coronavirus is that excess deaths have not materialised to the extent that was seen in the first wave in Spring 2020. In investigating this, we believe there is a flaw in the way that government reports excess deaths and using a different (and in my view superior) method changes the conclusions that can be drawn. Let’s look at the three definitions of COVID deaths used by the UK government and see what could be done to improve them.
The first metric is deaths within 28 days of a positive COVID-19 test. This metric is fairly easily produced but primarily covers deaths in hospital. It may also record deaths with COVID rather than deaths from COVID. For example, a patient coming into ICU with a stroke who was tested positive whilst in hospital and subsequently died would count as a COVID death under this definition. So would a patient who recovered from COVID but was killed on the way home from hospital in a road traffic accident. But deaths from COVID where a test had not been undertaken would not be recorded as a COVID death – many deaths at home or in a care home would fall into this category. On balance, this metric may well understate the number of COVID deaths (both from and with COVID).
The second metric is deaths where COVID is mentioned on the death certificate. This overcomes the issue of people dying from COVID without having a test but does leave the cause of death to the judgement of the doctor completing the certificate. At the present time, many deaths from a respiratory illness would be classified as COVID even if some were influenza or pneumonia. We might therefore expect this metric to overstate COVID deaths (both from and with COVID).
The concept of excess deaths was developed to resolve the issues with the above two measures. Excess deaths is defined as the difference between the actual number of deaths each week and the expected number based upon historical evidence. At present, the expected number of deaths each week is taken as the average number from the past five years (so for 2020 the expected number of deaths is the average from the years 2015-2019).
With data from England and Wales, we can analyse each of these metrics into groups of weeks and the attached table does this for three periods:
- Pre COVID – January and February 2020
- The first wave – March to July 2020
- The second wave – August to December 2020
| Category | Pre-COVID | Wave 1 | Wave 2 | Total | Total |
| Jan-Feb | Mar-Jul | Aug-Dec | since March | Year | |
| Total deaths | 99,355 | 273,739 | 234,018 | 507,757 | 607,112 |
| Expected deaths | 103,505 | 214,311 | 202,812 | 417,123 | 520,628 |
| COVID deaths (1) | 0 | 38,224 | 31,540 | 69,764 | 69,764 |
| COVID deaths (2) | 0 | 51,210 | 29,620 | 80,830 | 80,830 |
| COVID deaths average | 0 | 44,717 | 30,580 | 75,297 | 75,297 |
| Excess deaths | -4,150 | 59,428 | 31,206 | 90,634 | 86,484 |
| Non-COVID excess deaths | -4,150 | 14,711 | 626 | 15,337 | 11,187 |
Note:
COVID deaths (1) deaths within 28 days of a positive test
COVID deaths (2) on death certificates
COVID deaths average – the average of these two figures
The two columns at the end show the cumulative totals since March and also for the full year.
Looking initially at the first wave data, we can see that deaths within 28 days of a positive test are exceeded by the number on death certificates, which in turn are exceeded by the estimated number of excess deaths (38,224 then 51,210 then 59,428). However, if we look at the second wave, we can see that the number of excess deaths is very similar to both of the other two measures. And excess deaths so far in five months of the second wave is around half the number recorded in the five months of the first wave.
There are two reasons that could be showing this result. Firstly, as we speculated in our article on Mortality on 9 July 2020 many deaths in the first wave were deaths brought forward in time – “As many of those dying from COVID-19 are either old and/or have prior medical conditions, it is quite likely that many would have died in the near future in the absence of the coronavirus pandemic – the virus has brought their death forward, for some by a few weeks, for others longer. So as time goes by, we would expect “excess deaths” each week to be negative – those expected to die would have already done so – and the cumulative figure to decline”. This prediction does seem to have been borne out in the data for the second wave.
The second possible reason for lower excess deaths is that deaths attributed to COVID either after a positive test or on certificates are actually deaths from another cause, possible influenza or pneumonia, as suggested earlier. One characteristic of this Winter season so far appears to be the virtual absence of any activity due to influenza. The PHE weekly surveillance report contains the following chart which shows admissions to ICU for COVID and also for influenza (the line running at zero):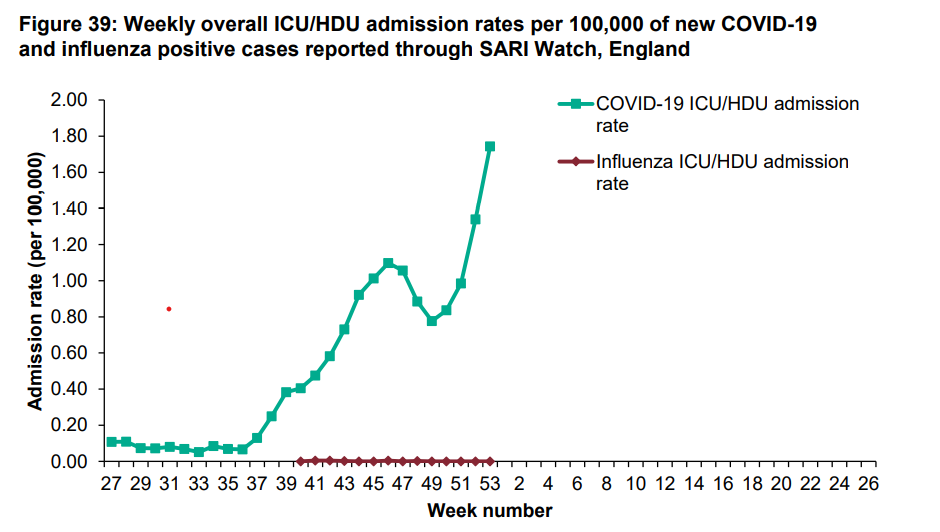
Another twist on this data comes from looking at the definition of the expected number of deaths based upon historical evidence. As mentioned, this is currently taken as the average number of deaths each week for the past five years; where actual deaths exceed this figure, the difference can be attributed to some exceptional situation. In previous years, this might have been a mild or heavy flu season or a prolonged spell of hot weather; in 2020, excess deaths have been assigned to or from COVID-19.
But is the five year average the best figure to use to estimate the number of expected deaths in 2020? The chart below shows the number of deaths each year in England and Wales, for the past thirty years.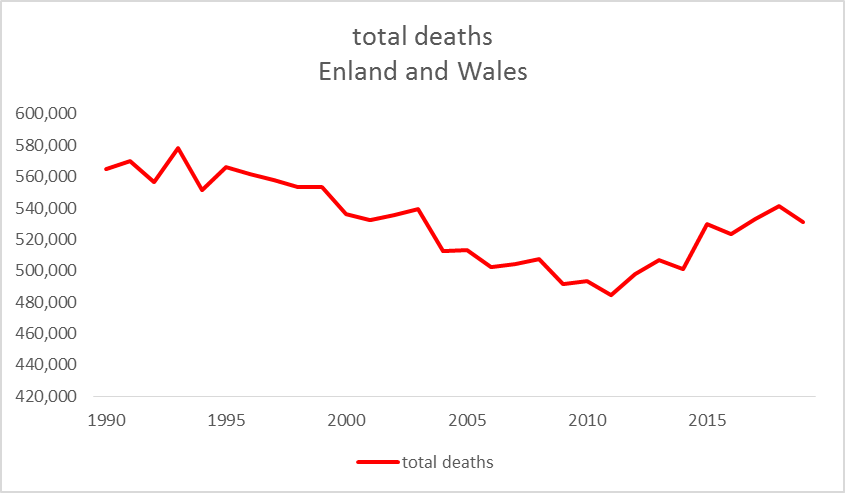
From the mid-1990’s until 2010, the number of deaths dropped steadily, with perturbations about this trend due to the factors mentioned above. The steady fall in the number of deaths was attributed to longer life expectancy as a result of better nutrition and lifestyles. From 2011 onwards, there has been an increase in the number of deaths, again with perturbations. The gains in life expectancy were slowing down but the bigger factor is likely to have been the impact of the baby boomer generation, who were moving into their 60’s and 70’s during this time. The surge in births after the Second World War is now leading inextricably to a surge in deaths.
Given this phenomenon, you would have thought that the Government Actuary’s Department would be applying their most up to date mortality tables to the population age structure at the start of 2020 to determine a better estimate of expected deaths than using the five-year average; but apparently not (well, I couldn’t find it anywhere on gov.uk).
The upward trend in deaths shown in this chart since 2011 is 1.23% per year. If we apply that for three years to the five-year average (the five years 2015-2109 will be centred on 2017) this gives an estimated number of deaths in 2020 which is 3.7% higher than the five-year average. I’ve used this figure to update the expected deaths and the table which then shows excess deaths based upon this new (more realistic, though somewhat simplified) number of expected deaths.
| Category | Pre-COVID | Wave 1 | Wave 2 | Total | Total |
| Jan-Feb | Mar-Jul | Aug-Dec | since March | Year | |
| Total deaths | 99,355 | 273,739 | 234,018 | 507,757 | 607,112 |
| Expected deaths
|
107,319
|
222,207
|
210,285
|
432,492
|
539,810
|
| COVID deaths (1) | 0 | 38,224 | 31,540 | 69,764 | 69,764 |
| COVID deaths (2) | 0 | 51,210 | 29,620 | 80,830 | 80,830 |
| COVID deaths average | 0 | 44,717 | 30,580 | 75,297 | 75,297 |
| Excess deaths
|
-7,964
|
51,532
|
23,733
|
75,265
|
67,301
|
| Non COVID excess deaths | -7,964 | 6,815 | -6,847 | -32 | -7,996 |
The expected deaths and therefore the excess deaths are the only lines in this table that are different from the original. But we can now see that the total excess deaths since March at 75,265 is now very similar to the average from the two direct measures (75,297). There are still more excess deaths in the first wave but as mentioned previously this will include a number of people that would have died anyway in 2020, the first wave has brought their deaths forward.
This change in the definition of expected deaths changes the conclusions we draw about the number of excess deaths and how many of them are due to or from COVID – virtually all of them when you look at the revised definition. I would argue this is an important point and that at least some debate on the basis of calculating the number of excess deaths is warranted. Indeed, I would go further and say that with evidence of a rising trend in the number of deaths, it does not make a lot of sense to use a five-year average as the basis of the calculation. But that’s just my view which is I guess why I write this column!
This article is one of a series, find last week’s article “New Variant” here.
