
29 July 2021
Lies, Damned Lies and Coronavirus
Are we there yet?
by David Chilvers
 Summer holidays seem to be back in full swing, even if more are staycations than running the gamut of the Governments green/amber/red system for returning from overseas. Those with children will be familiar with the question “are we there yet” in relation to holiday travel and this week I want to look at whether we are there yet in relation to the state of the pandemic. An (unnamed) senior Government minister was reported as saying that to all intents and purposes, the pandemic was over and even the serial harbinger of doom Neil Ferguson commented yesterday that “the pandemic in UK could largely be over by October”. This was just a week after commenting on the Andrew Marr show that it was almost inevitable that Monday’s final phase of unlocking would bring on 100,000 daily cases, with about 1,000 hospitalisations – despite roughly half the UK being fully vaccinated. He added that he could foresee a situation in which the case rate expands to twice the size. The real question is “do we get to double that – or even higher”
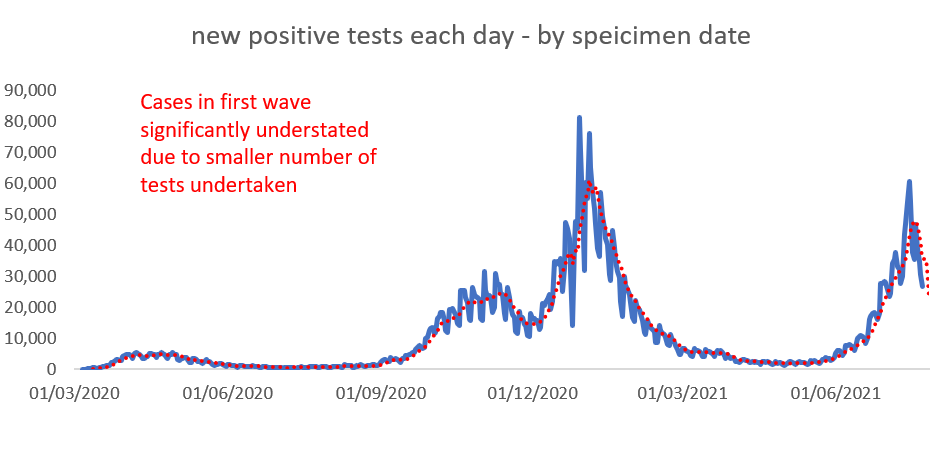
This forecast made just a week ago by Professor Ferguson seems to be as adrift from reality as most of his previous forecasts, but what is the data telling us about the current situation? With regard to the number of positive tests, these have dropped steadily over the past few days, although the full effect of the July 19th “Freedom Day” will not be apparent yet. The chart below shows how the number of positive tests has varied since March last year (but please remember that full testing was not in place until June 2020) – the red line shows the 7-day moving average
You can see here that the number of positive tests rose rapidly during June but now appears to be on a downward trend. But this does not tell the whole story as, over time, the number of tests undertaken has been steadily increasing.

There was a surge in the number of tests undertaken in February/March this year but apart from that the underlying trend is upwards over time as testing capacity has expanded. So positive tests are at a lower level now than in the January-March wave but the number of tests has gone up. As a result, the percentage of tests undertaken that are positive has gone up since June, but reached nothing like the levels of the Spring 2021 wave and is now starting to decline.
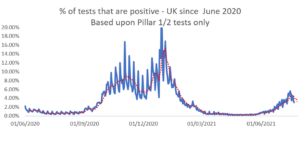
For this chart, we have started the series from 1 June last year, once mass testing was available. As can be seen, in the Spring 2021 wave, the percentage of tests that were positive reached nearly 20%, since June it has only reached 5%, one quarter of the previous peak level. Of course, much of this is down to the vaccine reducing transmission of COVID-19 but it is also due to the testing becoming less focused on symptomatic cases, with twice weekly testing in senior schools, hospitals and many other working establishments.
Given this, it is not that surprising that the number of hospital admissions is around one quarter of that recorded in the Spring 2021 wave.
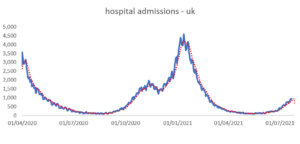
This number will continue to rise for a few days until the drop in the number of positive tests starts to have an impact. And as an aside, PHE England finally produced data on the number of COVID-19 infections acquired after a patient was brought into hospital – at present if you come into hospital with a heart attack, stroke or other emergency and test positive on the day of entry or subsequently you count as a COVID patient (and any deaths from the condition that brought you into hospital count as a COVID death). This is one of the reasons that deaths with 28 days of a positive COVID test – the Governments preferred measure – continue to significantly exceed the published number of excess deaths (and even these exceed the real number of excess deaths as the baseline to calculate excess deaths does not include the current natural upward trend of normal deaths caused by the baby boomer generation).
Even though the deaths after 28 days metric overstates COVID deaths, the latest figures show an even greater impact of the vaccine rollout on deaths than on hospitalisations.
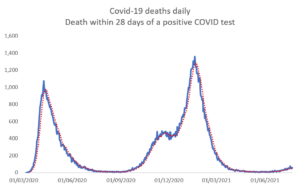
Although there is an upward trend and the figure published yesterday exceeded 100 for the first time since March, this compares to a peak of nearly 1,400 per day in February 2021, at the height of the Spring 2021 Wave.
So, there we have it:
- The number of positive tests has started to decline both in absolute terms and as a percentage of tests undertaken, the latter being well below the levels reached earlier this year
- Hospital admissions are still trending upwards, but at a quarter of the level seen in February and should be levelling off shortly
- Deaths are creeping upwards but at about 6% of the level seen in February
Does this mean the pandemic is over? Probably not, but I think it does mean the impact that COVID-19 is now having on normal life is considerably reduced and we are seeing this coronavirus to be much more like other such viruses, which we have learned to live with through a combination of a vaccination programme and sensible public health measures. The need for the Government to regulate so much of our lives has probably gone but whether politicians will easily relinquish the control they have been able to exercise over the past eighteen months is still up for debate. Compulsory vaccination for certain jobs, vaccine passports for attending specific events and the need for returning university students to be double-jabbed all seem to be part of current thinking. We have never resorted to such measures for other respiratory illnesses such as influenza and they are probably contrary to a wide range of human rights legislation. When the Shaw Sheet returns from its summer break in September, we will have a clearer idea of both the state of the pandemic and the extent to which freedoms we have taken for granted for years are likely to continue to be suppressed. Enjoy the break!
This article is one of a series, the previous article looking at the pingdemic is here.
