
17 June 2021
Lies, Damned Lies and Coronavirus
It seems like yesterday
by David Chilvers

This week, Boris Johnson confirmed the widely leaked delay of the fourth and final phase out of lockdown. The rationale was that the data had failed the fourth test set by the Government as there is concern over the spread of the Delta (Indian) variant. The four tests are:
- The vaccine deployment programme continues successfully
- Evidence shows vaccines are sufficiently effective in reducing hospitalisations and deaths in those vaccinated
- Infection rates do not risk a surge in hospitalisations which would put unsustainable pressure on the NHS
- The assessment of the risks is not fundamentally changed by new variants of concern.
The Prime Minster commented that “now is the time to ease off the accelerator because by being cautious now we have the chance – in the next four weeks – to save many thousands of lives by vaccinating millions more people”. The current rate of first vaccinations is about 200k per day, so the next four weeks should enable another six million people to have a first dose, taking the total with at least one dose to around 48 million, or over 80% of all adults. The number of second vaccinations is currently running at about 350k per day, so the next four weeks should enable another 10 million people to have a second dose, taking the total double dosed to around 40 million people, or over 70% of the adult population. So, the part of the Prime minister’s comment about the extra four weeks allowing millions more jabs is undeniably the case.
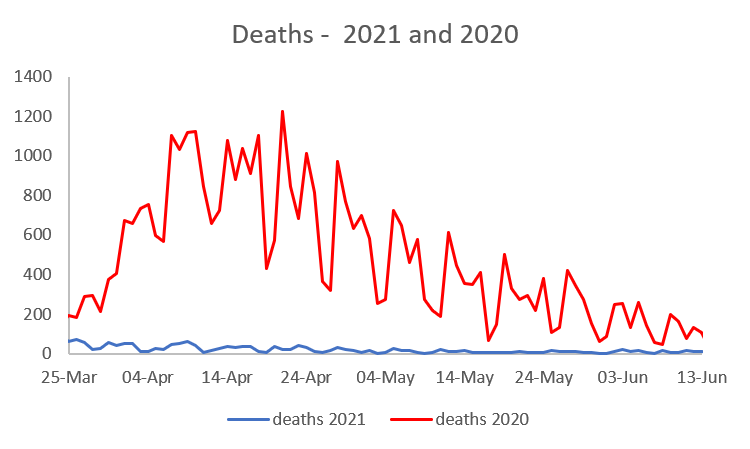
But what about saving thousands of lives? The current level of mortality from/with COVID-19 is very low, at around 10 deaths per day. Even if this quadrupled following a Step 4 relaxation, it would take 50 days to get to a cumulative 2,000 deaths (I’m assuming that “thousands of deaths being saved” is at least 2,000). And that would be the total number of deaths, not any additional deaths caused by the relaxation, so the figure is probably more than sixty days or two months. This would also mean substantially more deaths than occurred in the same period last year, when there were few lockdown rules and no vaccine. In the two months from 21st June last year, there were 1,559 deaths within 28 days of a positive COVID test. This year, with the vaccines, the number of deaths is much lower, as the chart below demonstrates, comparing March to early June with the same days last year.

Deaths this year are substantially below last year (it’s the blue line at the bottom of the chart, so low that it can hardly be seen), so we might expect even if restrictions were lifted (to be reasonably comparable to 2020) that there would be less deaths than last year – so less than 1,559 and not “thousands”.
A similar pattern exists if we look at hospital admissions. Last year, admissions were falling from the peaks in April, whilst this year the peaks were in January and February. There is some evidence of a slight increase in the last few weeks but this is a modest upward trend not any “exponential” growth.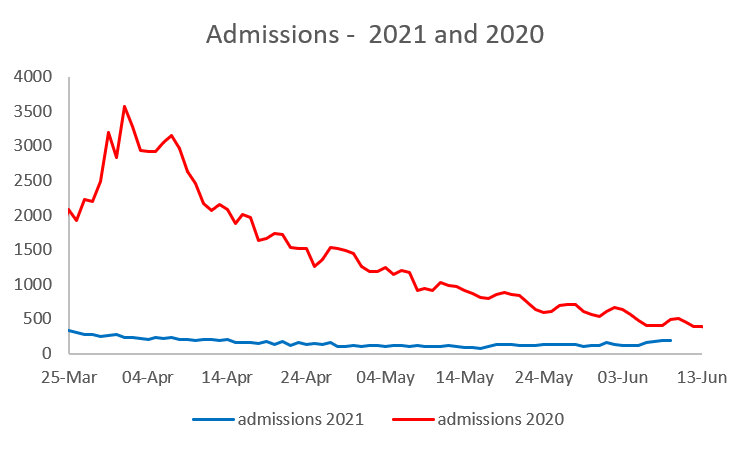
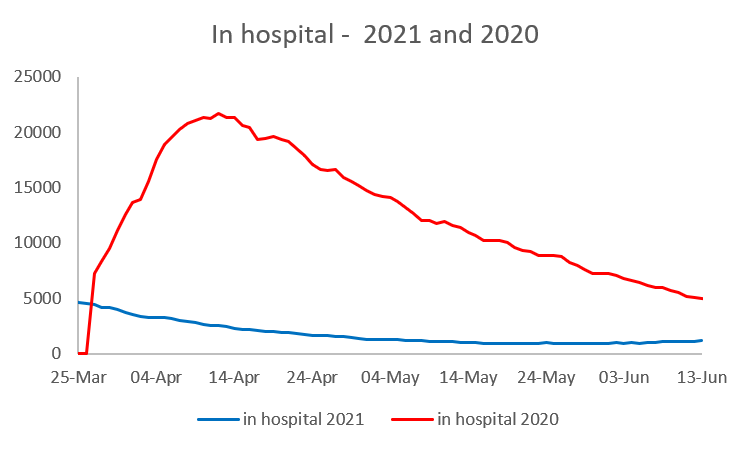
If we look at the number of patients in hospital, we see even less of an uptick in recent weeks and numbers only around one fifth of the level seen a year ago. No exponential growth here either.
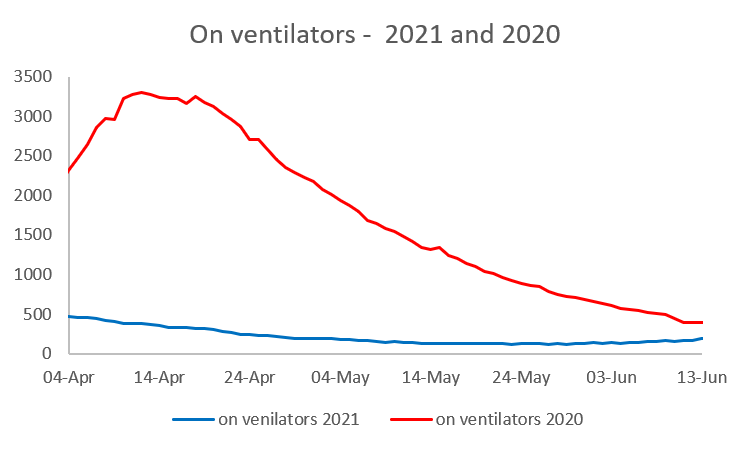
The numbers in hospital most seriously ill, on ventilators, show a similar pattern, although the lines are closer together than for deaths, admissions or patients in hospital.
So, in comparing data to the same period last year, when there was no vaccine protection, we can see there are no exponential upward trends in admissions, patients in hospital, those on ventilators and deaths from/with COVID-19. And indeed, much of the spread of infection appears to be in hospital not in the community. A recent paper by SAGE concluded that 20-25% of cases in the first wave may have been nosocomial (i.e. caught in hospital after admission for something else). There have been other estimates that this could be as high as 40% but Paul Hunter, Professor in Medicine at the University of East Anglia, thinks this is probably an upper bound:
“This is not that surprising. As a country, we did not manage the first wave of the epidemic at all well, especially as regards the protection of our most vulnerable individuals and our healthcare and care workers.
“The exact proportion of people with a nosocomial depends in part on how you define that. The 40% figure is probably too high, but maybe not by that much”.
We can’t provide a year-on-year comparison for cases (positive tests) as the level and type of testing is so much higher now (100k tests per day in early June 2020 and around 1 million a day now). Case numbers continue to be high, but seem to have stabilised between 7,000 and 8,500 over the past seven days (although today’s figure is a little over 9,000) but the link to severe forms of the disease does appear to be mitigated by the vaccination programme with Pfizer being 96% effective for preventing hospitalisation after two doses and Astra Zeneca 92% against the Delta variant. This explains why the trends in hospitalisations, use of ventilators and mortality are nothing like as steep as the rise in case numbers.
This article is one of a series, last week’s article on the it’s all Greek to me is here.
